Scilab-Branch-5.3-GIT
- Scilab help
- CACSD
- abcd
- abinv
- arhnk
- arl2
- arma
- arma2p
- armac
- armax
- armax1
- arsimul
- augment
- balreal
- bilin
- black
- bode
- bstap
- cainv
- calfrq
- canon
- ccontrg
- chart
- cls2dls
- colinout
- colregul
- cont_frm
- cont_mat
- contr
- contrss
- copfac
- csim
- ctr_gram
- dbphi
- dcf
- ddp
- des2ss
- des2tf
- dhinf
- dhnorm
- dscr
- dsimul
- dt_ility
- dtsi
- equil
- equil1
- evans
- feedback
- findABCD
- findAC
- findBD
- findBDK
- findR
- findx0BD
- flts
- fourplan
- frep2tf
- freq
- freson
- fspecg
- fstabst
- g_margin
- gainplot
- gamitg
- gcare
- gfare
- gfrancis
- gtild
- h2norm
- h_cl
- h_inf
- h_inf_st
- h_norm
- hallchart
- hankelsv
- hinf
- imrep2ss
- inistate
- invsyslin
- kpure
- krac2
- lcf
- leqr
- lft
- lin
- linf
- linfn
- linmeq
- lqe
- lqg
- lqg2stan
- lqg_ltr
- lqr
- ltitr
- m_circle
- macglov
- markp2ss
- minreal
- minss
- mucomp
- narsimul
- nehari
- nicholschart
- noisegen
- nyquist
- obs_gram
- obscont
- observer
- obsv_mat
- obsvss
- p_margin
- parrot
- pfss
- phasemag
- ppol
- prbs_a
- projsl
- reglin
- repfreq
- ric_desc
- ricc
- riccati
- routh_t
- rowinout
- rowregul
- rtitr
- sensi
- sgrid
- show_margins
- sident
- sm2des
- sm2ss
- sorder
- specfact
- ss2des
- ss2ss
- ss2tf
- st_ility
- stabil
- svplot
- sysfact
- syssize
- tf2des
- tf2ss
- time_id
- trzeros
- ui_observer
- unobs
- zeropen
- zgrid
- nyquistfrequencybounds
Please note that the recommended version of Scilab is 2026.1.0. This page might be outdated.
See the recommended documentation of this function
hallchart
ホール図を描画
呼び出し手順
hallchart([ modules [,args [,colors]]])
パラメータ
- modules
実数ベクトル (モジュール (単位: dB))
- args
実数ベクトル (位相 (単位:度))
- colors
スカラーまたはベクトル, 等ゲインおよび等位相曲線の色インデックス
説明
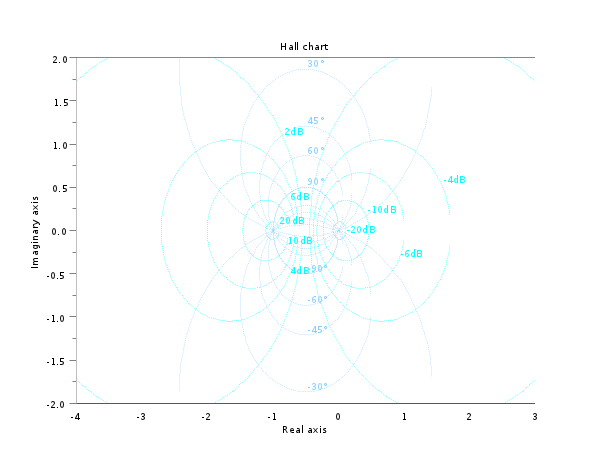
ホール図をプロット: real(y), imag(y) 平面における
y/(1+y) の等モジュールおよび等引数等高線
hallchart は
nyquistと組み合わせて使用することができます.
modulesおよびargsのデフォルト値は
それぞれ次のようになります :
[-20 -10 -6 -4 -2 2 4 6 10 20]
[-90 -60 -45 -30 -15 15 30 45 60 90]
この関数はm_circle 関数の後継です
グラフィックエンティティの構成
hallchart関数は通常カレントの軸の最後の子である
Compoundオブジェクトを1つ作成します.
このCompoundオブジェクトには各グリッド曲線に一つずつの
compoundオブジェクトの集合が含まれます.
最初のオブジェクトは,等モジュール曲線,最後のオブジェクトは
等引数等高線となります.
これらのcompoundオブジェクトの各々には,
ポリラインオブジェクト(曲線)とテキストオブジェクト(ラベル)が含まれます.
以下のコードをi番目の等モジュール曲線の色を変更する際に使用することができます:
例
//ホール図
clf();hallchart()
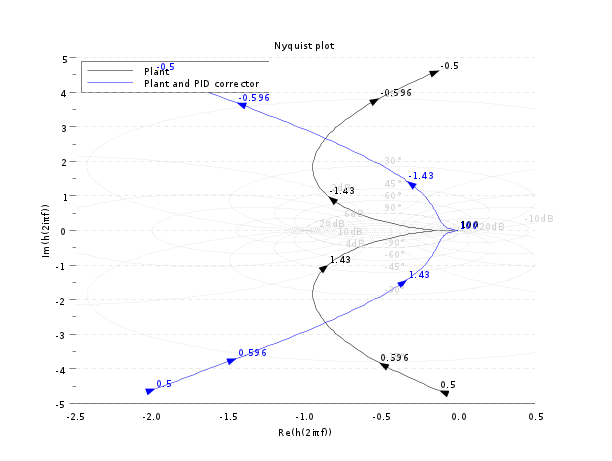
//ナイキストのグリッドとしてホール図を作成
s=poly(0,'s');
Plant=syslin('c',16000/((s+1)*(s+10)*(s+100)));
//二自由度PID
tau=0.2;xsi=1.2;
PID=syslin('c',(1/(2*xsi*tau*s))*(1+2*xsi*tau*s+tau^2*s^2));
clf();
nyquist([Plant;Plant*PID],0.5,100,["Plant";"Plant and PID corrector"]);
hallchart(colors=color('light gray')*[1 1])
//右下隅のキャプションを移動
ax=gca();Leg=ax.children(1);
Leg.legend_location="in_lower_right";
参照
- nyquist — ナイキスト線図
- nicholschart — ニコルス線図
| << h_norm | CACSD | hankelsv >> |