contourf
2次元プロット上に曲面の塗りつぶした等高線を描画
呼び出し手順
contourf(x, y, z, nz, [style, strf, leg, rect, nax, fpf])
引数
- x,y
大きさ
n1およびn2の実数行ベクトル: グリッド.- z
大きさ
(n1,n2)の実数行列, 関数の値.- nz
等高線の値または数.
- -
nzが整数の場合, その値は等高線の数を 指定し,zminからzmaxの間で以下のように等間隔に配置されます:z= zmin + (1:nz)*(zmax-zmin)/(nz+1)
 注意:
注意:zminおよびzmaxの等高線は描画されません ( 通常,これらは点に縮小されます)が,以下のコマンドで追加できることに 注意してください.- -
nzがベクトルの場合,nz(i)はi番目の等高線の値を指定します.
- style, strf, leg, rect, nax
plot2d参照. 引数styleは等高線で使用される色を指定します. これは等高線の数と同じ大きさである必要があります.- fpf
You can change the format of the floating point number printed on the levels where
fpfis the format in C format syntax (for examplefpf="%.3f"). Setfpfto " " implies that the level are not drawn on the level curves. If not given, the default format of contour2d is used.
説明
contourf は,2次元プロット上の
曲面z=f(x,y)の
連続する2つの等高線の間の曲面を塗りつぶします.
f(x,y)の値はx
およびyで定義されたグリッド点で
行列zにより指定されます.
コマンド contourf()を入力することでデモを
参照できます.
例
例
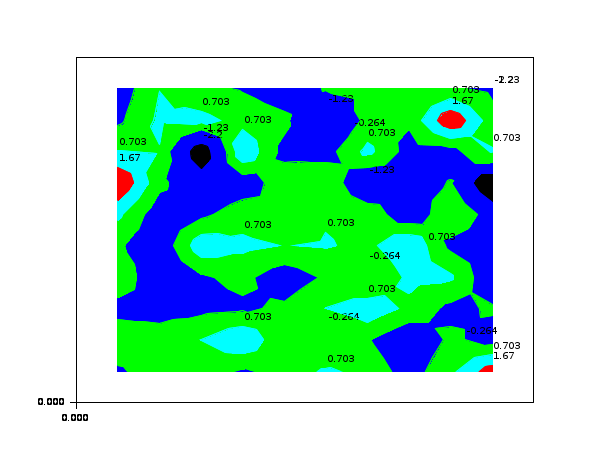
contourf(1:10,1:10,rand(10,10),5,1:5,"011"," ",[0,0,11,11])

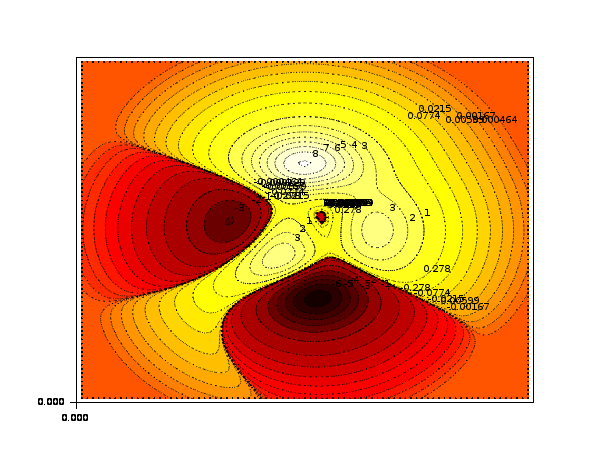
function z=peaks(x, y)
x1=x(:).*.ones(1,size(y,'*'));
y1=y(:)'.*.ones(size(x,'*'),1);
z =  (3*(1-x1).^2).*exp(-(x1.^2) - (y1+1).^2) ...
   - 10*(x1/5 - x1.^3 - y1.^5).*exp(-x1.^2-y1.^2) ...
   - 1/3*exp(-(x1+1).^2 - y1.^2)
endfunction
function z=peakit()
x=-4:0.1:4;y=x;z=peaks(x,y);
endfunction
z=peakit();
levels=[-6:-1,-logspace(-5,0,10),logspace(-5,0,10),1:8];
m=size(levels,'*');
n = fix(3/8*m);
r = [(1:n)'/n; ones(m-n,1)];
g = [zeros(n,1); (1:n)'/n; ones(m-2*n,1)];
b = [zeros(2*n,1); (1:m-2*n)'/(m-2*n)];
h = [r g b];
gcf().color_map = h;
clf();
contourf([],[],z,[-6:-1,-logspace(-5,0,10),logspace(-5,0,10),1:8]);

参照
- contour — 3次元曲面に等高線を描画
- contour2d — 2次元プロット上に曲面の等高線を描画
- contour2di — 2次元プロット上の曲面の等高線を計算
- plot2d — 2Dプロット
| Report an issue | ||
| << contour2dm | 2d_plot | cutaxes >> |