champ
2次元ベクトルフィールドのプロット
呼び出し手順
champ()  // example
champ(x, y, fx, fy)
champ(x, y, fx, fy, arfact)
champ(x, y, fx, fy, arfact, rect)
champ(x, y, fx, fy, arfact, rect, strf)
champ(x, y, fx, fy, <opt_args>)
引数
- x,y
vectors of decimal numbers, which define the grid of nodes = coordinates of arrows starting points.
- fx
ベクトルフィールドのx要素を記述する行列.
fx(i,j)は点(x(i),y(j))における ベクトルフィールドのx要素です.- fy
ベクトルフィールドのy要素を記述する行列.
fy(i,j)は点(x(i),y(j))における ベクトルフィールドのy要素です.- <opt_args>
一連の命令
key1=value1,key2=value2,... を表します. ただし,key1,key2,...には以下のどれかを指定可能です: arfact, rect, strf (以下参照).- arfact
実数型のオプションの引数で, プロット時の矢じりの表示用のスケールファクタを指定します. (デフォルト値は 1.0).
- rect
使用するグラフィックフレームの境界を指定する ベクトル
rect=[xmin,ymin,xmax,ymax].- strf
長さ3の文字列 "xyz" で,
plot2dのstrfパラメータと意味は同じです. 最初の文字xはchampでは意味がありません.
説明
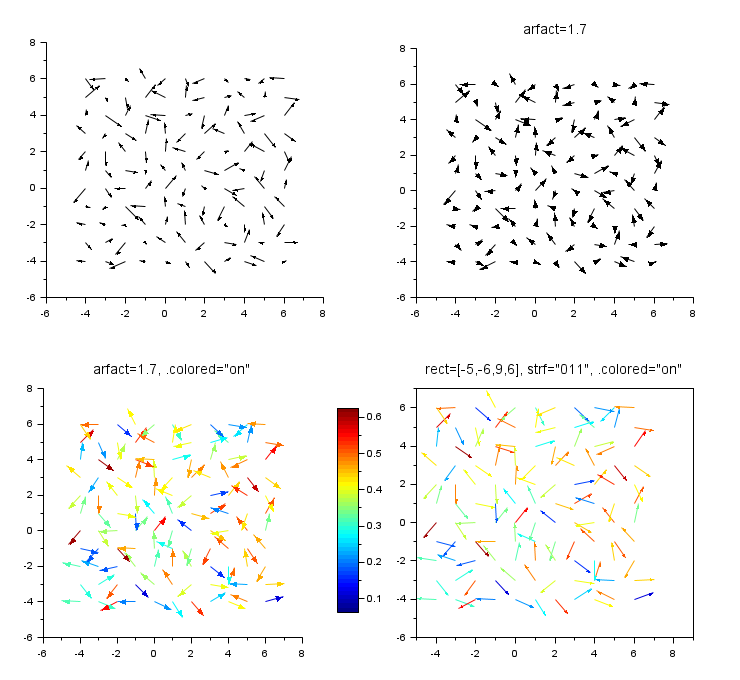
champ(…) plots a field of 2D vectors with arrows.
By default, all arrows have the same color, and their length is proportional to the local intensity of the field (norm of vectors). In addition, all lengths are normalized according to the longest arrow.
When setting gce().colored = "on",
each arrow becomes as long as possible in its cell, and is colored
according to the local intensity of the field.
After calling champ(…), gce()
returns the handle of the field of arrows, of type Champ,
whose properties can be post-processed.
コマンド champ() を入力するとデモが表示されます.
例
x = -4:6;
X = ndgrid(x);
[fx, fy] =  (rand(X)-0.5, rand(X)-0.5);

clf
gcf().color_map = jetcolormap(50);

// Field's intensity = arrows length
subplot(2,2,1)
champ(x, x, fx, fy)

// With bigger arrow heads
subplot(2,2,2)
champ(x, x, fx, fy, arfact=1.7)
title("arfact=1.7", "fontsize",3)

// Field's intensity = arrows color
xsetech([0 0.5 0.55 0.5])
champ(x, x, fx, fy, arfact=1.7)
gce().colored = "on";
title("arfact=1.7, .colored=""on""", "fontsize",3)
colorbar

// Field's intensity = color, + imposed boundaries
subplot(2,2,4)
champ(x, x, fx, fy, rect=[-5,-6,9,7],strf="011")
gce().colored = "on";
title("rect=[-5,-6,9,6], strf=""011"", .colored=""on""", "fontsize",3)

gcf().axes_size = [740 680];
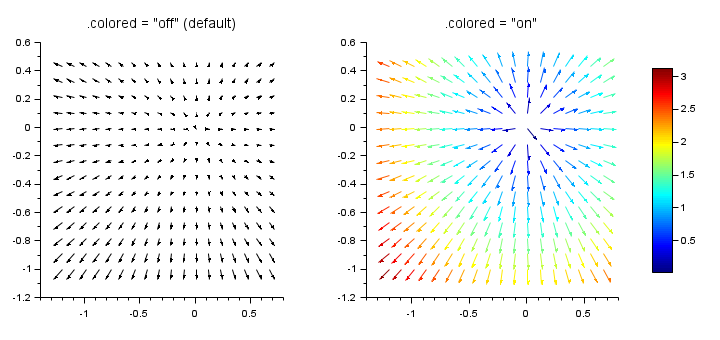
x = -1.2:0.11:0.7;
y = -1:0.11:0.5;
[X, Y] = ndgrid(x, y);
[fx, fy] = (2*X, 2*Y);

clf
xsetech([0 0 0.45 1])
champ(x, y, fx, fy)
title(".colored = ""off"" (default)", "fontsize",3)
xsetech([0.45 0 0.55 1])
champ(x, y, fx, fy)
title(".colored = ""on""", "fontsize",3)
gce().colored = "on";

gcf().color_map = jetcolormap(100);
colorbar
参照
- champ_properties — 2次元ベクトルフィールドエンティティプロパティの説明
- fchamp — 2次元1階常微分方程式(ODE)のフィールド方向
- xarrows — 2Dまたは3Dで矢印を描画
- Arrowed polyline — Polylineエンティティプロパティの説明
| Report an issue | ||
| << 2d_plot | 2d_plot | champ_properties >> |