scatter
2D scatter plot
Syntax
scatter()   // Example
scatter(x, y)
scatter(x, y, msizes)
scatter(x, y, msizes, mcolors)
scatter(.., "fill")
scatter(.., "smallOnTop")
scatter(.., marker)
scatter(..., <marker_property, value>)
scatter(axes, ..)
polyline = scatter(..)
Arguments
- x, y
Columns or rows vectors of n real numbers specifying the abscissae and the ordinates of the centers of markers.
- axes
- Handle of the graphical axes in which the scatter plot must be drawn. By default, the current axes is targeted.
- polyline
- Handle of the created polyline.
- msizes
Sizes of the markers, as of the area of the circle surrounding the marker, in point-square. Default value = 36. If it is scalar, the same size is used for all markers. Otherwise
msizesandxmust have the same number of elements.- mcolors
Colors of markers. If it is scalar, the same color is used for all markers. Otherwise,
mcolorsandxmust have the same number of elements.The same color is used for filling the body and drawing the edge of markers.
The values of
mcolorsare linearly mapped to the colors in the current colormap.A color can be specified by one of the following:
- Its name, among the predefined names colors (see the color_list).
- Its standard hexadecimal RGB code as a string, like "#A532FB".
- A matrix of RGB values with 3 columns and n rows, with Red Green and Blue intensities in [0,1].
- Its index in the current color map
- "fill"
By default, only the edge of markers is drawn, unless this keyword or the
"markerFaceColor"or"markerBackgroundColor"properties are set.- "smallOnTop"
When markers have not all the same size and the population of points becomes crowdy, big markers can hide smaller ones located around the same place. This option can be used to avoid such masking effects. Then points are priorly sorted by decreasing sizes, in order to plot the smallest points at the end, on top of bigger ones.
- marker
Selects the shape of the markers. The same shape is used for all specified points. The figure below shows the 15 different marker shapes.
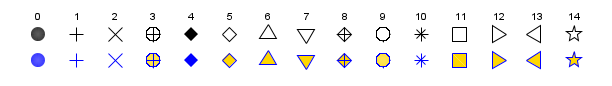
Each marker shape is specified either by its index (list above) or by its string symbol (table below).
Index String Marker type 0 "."Point 1 "+"Plus sign 2 "x"Cross 3 "circle plus"Circle with plus 4 "filled diamond"Filled diamond 5 "d"or"diamond"Diamond 6 "^"Upward-pointing triangle 7 "v"Downward-pointing triangle 8 "diamond plus"Diamond with plus 9 "o"Circle (default) 10 "*"Asterisk 11 "s"or"square"Square 12 ">"Right-pointing triangle 13 "<"Left-pointing triangle 14 "pentagram"or"p"Five-pointed star
Property Name, Value pairs
A series of property <Name,Value> pairs can be used to specify the filling color of markers body, the color and thickness of the markers edges, or the points on which a datatip must be created.
- "marker",value or "markerStyle",value
Shape of the marker (index or string keyword). See the table above.
- "markerEdgeColor",value or "markerForeground",value
Color of the edge of markers. Colors can be specified as for
mcolors. This option supersedesmcolors.- "markerFaceColor",value or "markerBackground",value
Color filling the body of markers. Colors can be specified as for
mcolors. This option supersedesmcolors.- "linewidth",value or "thickness",value
Specify the thickness of the edge for all markers. The unit for the value is one point.
- "datatips", k
Creates a datatip for all (X,Y) points whose indices are in the vector
k. 1:$ targets all existing points.The
datatip_display_modeis set to"mouseover". The datatip anchor is reduced to a point set at the middle of the marker. The default datatips display the (x,y) coordinates of the point. Ifmsizesis a vector, the size of each marker is also displayed.
Description
scatter(x,y) creates a scatter plot with markers centered at
the (x, y) set of coordinates.
The default type of the marker is a circle, the default color is "blue" and the default
size is 36.
This means the circle surrounding the marker has an area of 36 points squared.
Different sizes and colors for each marker can be specified with
scatter(x,y,msizes,mcolors).
There are many different ways to specify marker types, marker colors and marker sizes.
For more details see the description of the arguments and the examples.
 | To skip an argument, just .. skip it, or replace it with [], like in
scatter3d(x,y, , mcolors) or scatter3d(x,y,[], mcolors). |
Examples
You can easily categorize a dataset using colors.
// results between -1 and 1
t = linspace(0, 25, 200);
simResults = grand(200, 2, 'unf', -1, 1);
x = simResults(:,1)';
y = simResults(:,2)';

// categorize
c = 9*ones(x);
c(0.4 < x & x < 0.7 & 0.2 < y & y < 0.5) = 2;
c(0.8 < x & x < 1 & 0.3 < y & y < 1) = 3;
c(y > 2*x+0.3) = 4;
c(1 < y.*y + x.*x) = 5;

scatter(x, y, [], c, "fill");
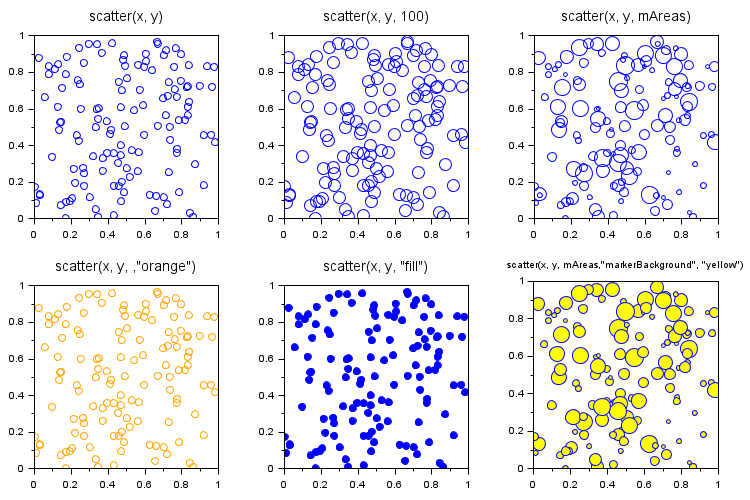
With the default circle shape, and the same color for all points:
n = 130;
x = rand(1,n);
y = rand(1,n);

clf
subplot(2,3,1)
scatter(x, y)
title("scatter(x, y)", "fontsize",3)

subplot(2,3,2)
scatter(x, y, 100)
title("scatter(x, y, 100)", "fontsize",3)

subplot(2,3,3)
mAreas = 10.^grand(1,n,"unf",1,2.4);
scatter(x, y, mAreas)
title("scatter(x, y, mAreas)", "fontsize",3)

subplot(2,3,4)
scatter(x, y, , "orange")
tit = "scatter(x, y, ,""orange"")";
title(tit, "fontsize",3)

subplot(2,3,5)
scatter(x, y, "fill")
tit = "scatter(x, y, ""fill"")";
title(tit, "fontsize",3)

subplot(2,3,6)
scatter(x, y, mAreas, "markerBackground", "yellow")
tit = "scatter(x, y, mAreas,""markerBackground"", ""yellow"")";
title(tit, "fontsize",1)
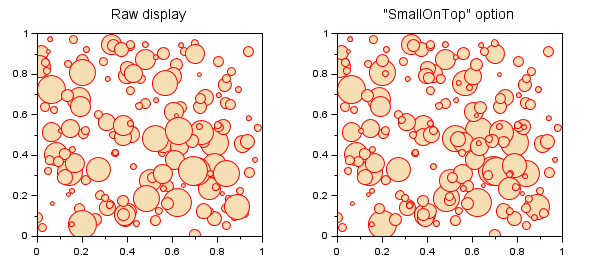
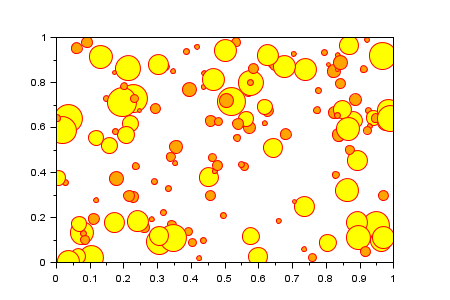
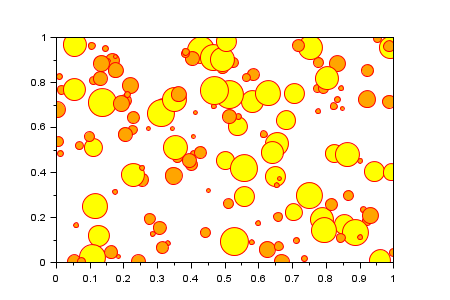
Option "smallOnTop", avoiding intermasking effects:
n = 170;
x = rand(1,n);
y = rand(1,n);
mAreas = 10.^grand(1,n,"unf",1,2.8);

clf
subplot(1,2,1)
scatter(x, y, mAreas, "wheat", "fill", "markerEdgeColor", "red")
title("Raw display", "fontsize",3)

subplot(1,2,2)
scatter(x, y, mAreas, "wheat", "fill", "smallOnTop", "markerEdgeColor", "red")
title("""SmallOnTop"" option", "fontsize",3)
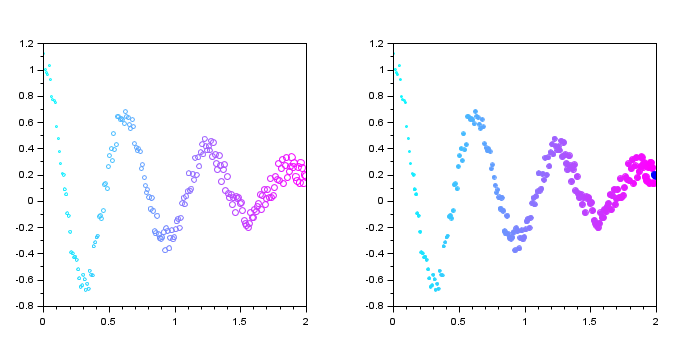
Vary marker size and color
x = linspace(0, 2, 200);
y = exp(-x).*cos(10*x) + 0.2*rand(1,length(x));

s = linspace(1, 30, length(x));     // specify different sizes
gcf().color_map = coolcolormap(64); // set color map
c = x;                  // colors according to x values
subplot(1,2,1)
scatter(x, y, s, c);    // create 2D scatter plot

// Fill the markers
subplot(1,2,2)
scatter(x, y, s, c, "fill");
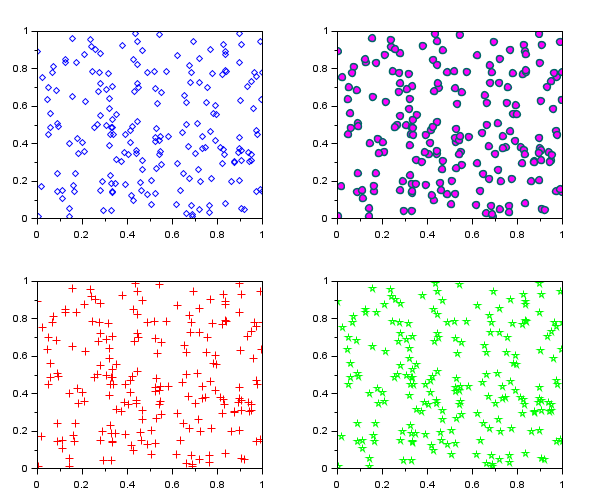
Specify the marker
x = rand(1, 200);
y = rand(1, 200);

subplot(2,2,1)
scatter(x, y, "d");

subplot(2,2,2)
scatter(x, y, "markerEdgeColor",[0 .4 .4],...
              "markerFaceColor","magenta",...
              "linewidth",1.5);

subplot(2,2,3)
scatter(x, y, 60, "red", "+");  // Marker's symbol

subplot(2,2,4)
scatter(x, y, 60, "green", 14); // Marker's index
Post-processing a scatter plot:
n = 150;
x = rand(1,n);
y = rand(1,n);
mAreas = 10.^grand(1,n,"unf",1,2.8);

clf
p = scatter(x, y, mAreas, "yel", "fill", "markerEdgeColor", "red")

// Post-processing
k = mAreas<median(mAreas)*2;
bg = ones(1,n) * p.mark_background;
bg(k) = color("orange");
p.mark_background = bg;
See also
- scatter3d — 3D scatter plot
- plot — 2Dプロット
- gca — カレントの軸のハンドルを返す.
- gcf — カレントグラフィックウインドウのハンドルを返す.
- color_list — 色の名前のリスト
- polyline_properties — Polylineエンティティプロパティの説明
History
| バージョン | 記述 |
| 6.0.0 | Function scatter() introduced. |
| 6.1.1 |
|
| Report an issue | ||
| << polarplot | 2d_plot | semilogx >> |