plot2d
2Dプロット
呼び出し手順
plot2d()   // example
plot2d(y)
plot2d(x, y)
plot2d(logflag, x, y)
plot2d(.., y, style)
plot2d(.., y, style, strf)
plot2d(.., y, style, strf, leg)
plot2d(.., y, style, strf, leg, rect)
plot2d(.., y, style, strf, leg, rect, nax)
plot2d(.., y, key1=value1, key2=value2, ..)
パラメータ
- x
実数の行列またはベクトル. 省略された場合, ベクトル
1:nが指定されたと仮定します. ただし,nはyパラメータで指定された曲線の点の数です.- y
実数の行列またはベクトル.
- key1=value1, key2=value2, ...
The following options
logflag,style,strf,leg,rect,nax,frameflag, andaxesflagdescribed below can either be listed in the right order as listed in the synopses, or provided in any order afteryas named arguments, for instance like inplot(y, frameflag=3, leg="Curve 1@Curve 2").- logflag
Sets the linear or logarithmic scale for both X and Y axes. Possible values are
"nn","nl","ln"or"ll"."n"stands for normal scale ;"l"stands for logarithmic. The first letter set the X axis. The second one sets the Y axis.- style に
各曲線のスタイルを設定します. 値は整数値(正または負)を有する実数ベクトルを指定します. 値には曲線と同じ数のエントリを有するベクトルを指定します.
style(i)が正の場合, 曲線は実線で描画され,style(i)は曲線の描画に使用される 色の添字を定義します(getcolor参照). 線のスタイルおよび太さはpolylineエンティティプロパティ (polyline_properties参照) により設定することができることに注意してください.style(i)が負またはゼロの場合, 指定した曲線の点はマーカにより描画されます,abs(style(i))は使用するマーカ id を定義します. マークの色および大きさはpolylineエンティティプロパティ (polyline_properties参照) により設定することができることに注意してください.
- strf
- 3-character-long string
"abc"specifying all together if legends must be displayed, and the values offrameflagandaxesflag. By default,strf= "081". "a", "b" and "c" are:a : 凡例の表示を制御します. a=0 : 凡例なし. a=1 : 凡例が表示されます.凡例は, オプションの引数 legで指定されます.b : frameflaginteger code in [0,9], controlling the computation the actual coordinate ranges, as described below.c : axesflaginteger code in [0:5 9], controlling the display and position of X and Y axes, as described below. - leg
このオプションは曲線の凡例を設定する際に使用されます.
"leg1@leg2@...."という形式の文字列とする 必要があります. ただし,leg1,leg2, ... はそれぞれ最初の曲線,2番目の曲線,... の凡例です. 曲線の凡例はx軸の下に描画されます. デフォルトは" "です.After plotting, the handle of the block of legends can be retrieved with
gca().children(2). captions, legend or legends can also be used instead ofleg.- rect
このオプションはプロット時に指定した最小限の範囲を設定する際に 使用できます. このオプションが指定された場合, 値は以下の4個のエントリを有する実数ベクトルとする必要があります:
[xmin,ymin,xmax,ymax].xminおよびxmaxは横座標の範囲を定義し,yminおよびymaxは縦座標の範囲を定義します.この引数は,指定した
rect引数に基づき軸境界を 定義する方法を指定するframeflagオプションと共に 使用することができます.frameflagオプションが指定されない場合,frameflag=7が仮定されます.軸境界も軸エンティティプロパティによりカスタマイズできます (axes_properties参照).
- nax
このオプションは軸ラベルおよび目盛定義を指定する際に使用できます. 値には4個の整数エントリ
[nx,Nx,ny,Ny]を有する実数ベクトルを 指定します.Nxはx軸で使用される主目盛の数 (autoticksの場合は-1を指定)を指定し,nxは2つのx軸主目盛の間に描画される副目盛の 数を指定します.Nyおよびnyは y軸の同様な情報を指定します.axesflagオプションが設定されない場合,naxオプションはaxesflagオプションが9に設定されていると 仮定します.- frameflag
controls the computation of the actual coordinate ranges from the minimal requested values. The associated value should be an integer ranging from 0 to 8.
frameflag axes bounds other actions 0 unchanged 1 from rect 2 from input x,y 3 from rect isometric axes 4 from input x,y isometric axes 5 from rect pretty axes 6 from input x,y pretty axes 7 from rect all replot with new scales 8 from input x,y all replot with new scales 9 from input x,y Pretty axes. All replot with new scales The setting of axes boundaries can also be customized through the
gca().data_bounds,gca().tight_limits,gca().data_bounds, andgca().isoviewproperties (see axes_properties).- axesflag
integer code in [0:5 9], controlling the display and position of X and Y axes.
The axes aspect can also be customized directly through the
gca().box,gca().axes_visible,gca().x_location, andgca().y_location, properties (see axes_properties).axesFlag .box .axes_visible axes position comments 0 "off" ["off" "off"] Naked plot 1 "on" ["on" "on"] 2 "on" ["off" "off"] Naked box 3 "off" ["on" "on"] y_location="right" 4 "off" ["on" "on"] crossed @ middle 5 "on" ["on" "on"] crossed @ middle 9 "off" ["on" "on"] (default setting)
説明
plot2d は一連の2次元曲線をプロットします.
指定した曲線の点の間は区分線形補間が行われます.
Any point with y(i)=Nan is masked: no mark and no segment to its
neighboors are displayed.
For any point with y(i)=±Inf, a vertical segment starting
from each of its both neighboors is drawn in the ± direction, up to the current ceil
or down to the current floor of the axes.
By default, successive calls to plot2d() overplots new curves over existing ones.
Autoclearing for each new plot can be set using gca().auto_clear="on".
Please see axes properties.
clf can also be used to manually clear
the whole figure.
Matlabのplot構文に慣れている場合には,
plotを使用するべきです.
x および y がベクトルの場合,
plot2d(x,y,<opt_args>) はベクトル y を
ベクトル xに対してプロットします.
ベクトルx および yは
同じ数のエントリを有する必要があります.
x がベクトルで y が行列の場合,
plot2d(x,y,<opt_args>) はyの各列を
ベクトルxに対してプロットします.
この場合,yの列の数はx
のエントリの数に等しい必要があります.
x および y が行列の場合,
plot2d(x,y,<opt_args>) はyの各列を
対応するxの列に対してプロットします.
この場合,x とyの
大きさは同じである必要があります.
y がベクトルの場合, plot2d(y,<opt_args>)
はベクトル y をベクトル
1:size(y,'*')に対してプロットします.
y が行列の場合, plot2d(y,<opt_args>)
はyの各列をベクトル
1:size(y,1)に対してプロットします.
プロットをカスタマイズするために引数<opt_args> を
使用することができます.
デモを参照するにはコマンド plot2d() を使用してください.
その他に以下のような高レベルplot2d 関数が存在します:
plot2d2 は
plot2dと同じですが,曲線は 区分定数と仮定されます.plot2d3 は
plot2dと同じですが, 曲線は 垂直棒グラフとしてプロットされます.plot2d4 は
plot2dと同じですが, 曲線は 垂直な矢印をでプロットされます.
例
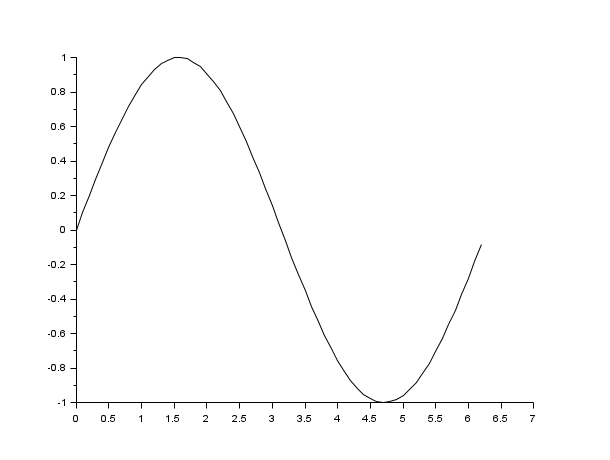
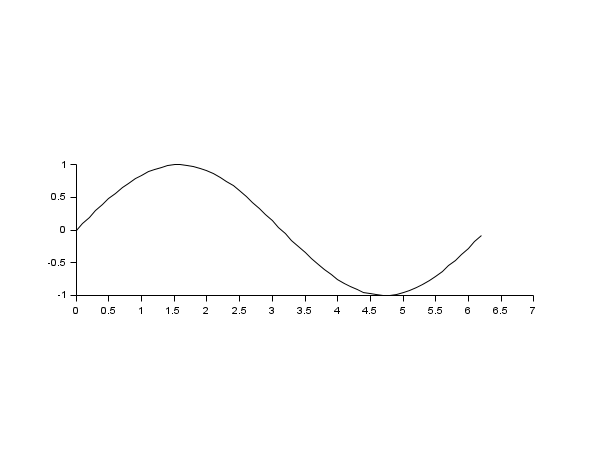
// x 初期化
x=[0:0.1:2*%pi]';
//簡単なプロット
plot2d(sin(x));

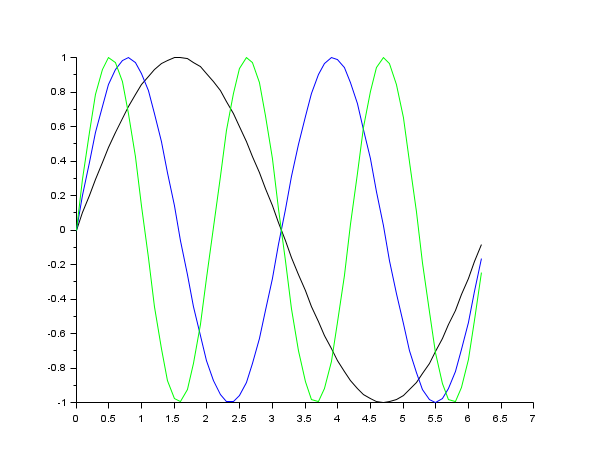
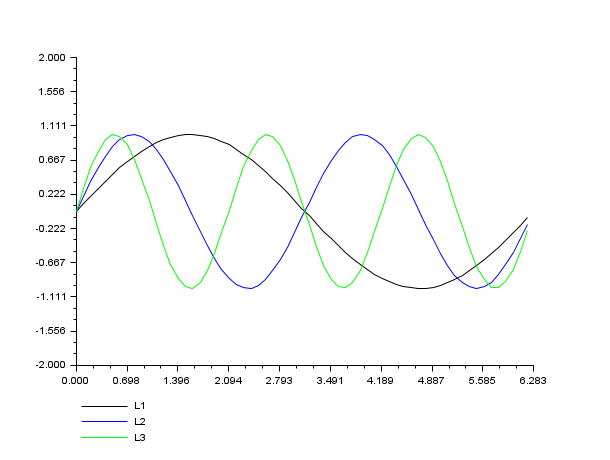
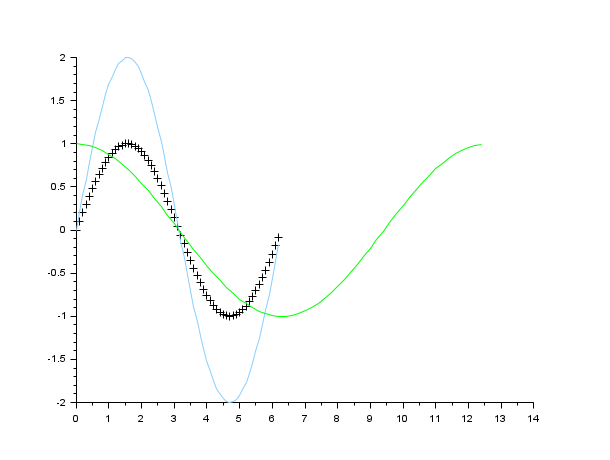
//凡例と目盛/スタイルを指定した複数プロット
clf();
plot2d(x,[sin(x) sin(2*x) sin(3*x)],..
       [1,2,3],leg="L1@L2@L3",nax=[2,10,2,10],rect=[0,-2,2*%pi,2]);


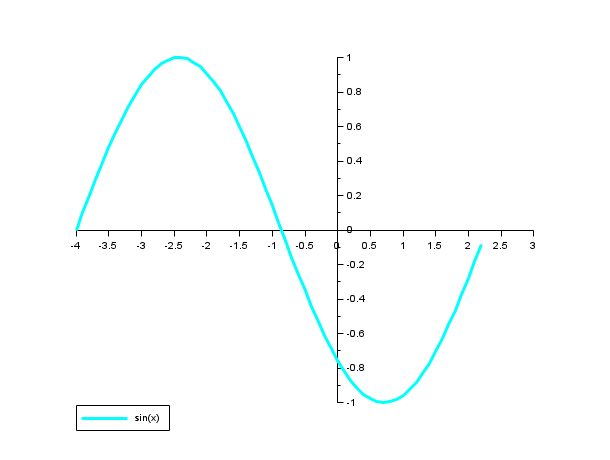
// 軸の中心を (0,0) に
clf();
plot2d(x-4,sin(x),1,leg="sin(x)");
a=gca(); // 軸エンティティのハンドル
a.x_location = "origin";
a.y_location = "origin";
// plot2dで作成されたエンティティを操作 ...
isoview
a = gca();
a.children // 軸の子の一覧.
// 2個のポリラインと1個の凡例からなる複合要素がある
poly1= a.children(1).children(1); //ポリラインのハンドルをpoly1に保存
poly1.foreground = 4; // スタイルを変更する別の方法...
poly1.thickness = 3;  // ...曲線の太さを変更.
poly1.clip_state='off'; // クリッピングの制御
leg = a.children(2); // 凡例のハンドルをlegに保存
leg.font_style = 9;
leg.line_mode = "on";
isoview off
参照
- plot — 2Dプロット
- .polyline_style — Polylineエンティティプロパティの説明
- plot2d2 — 2次元プロット (階段状関数)
- plot2d3 — 2次元プロット (垂直棒グラフ)
- plot2d4 — 2次元プロット (矢印形式)
- polarplot — 極座標プロット
- gca — カレントの軸のハンドルを返す. close — グラフィックフィギュア,進行バーまたは待機バー,ヘルプブラウザ,xcos,browsevar,またはeditvarを閉じます
- axes_properties — axesエンティティプロパティの説明
- clf — Clears and resets a figure or a frame uicontrol
| Report an issue | ||
| << plot | 2d_plot | plot2d2 >> |