champ
esboço de campo vetorial 2d
Seqüência de Chamamento
champ()  // example
champ(x, y, fx, fy)
champ(x, y, fx, fy, arfact)
champ(x, y, fx, fy, arfact, rect)
champ(x, y, fx, fy, arfact, rect, strf)
champ(x, y, fx, fy, <opt_args>)
Parâmetros
- x,y
vectors of decimal numbers, which define the grid of nodes = coordinates of arrows starting points.
- fx
uma matriz que descreve o componente x do campo vetorial.
fx(i,j)é o componente x do campo vetorial no ponto(x(i),y(j)).- fy
uma matriz que descreve o componente y do campo vetorial.
fy(i,j)é o componente y do campo vetorial no ponto(x(i),y(j)).- <opt_args>
representa a seqüência de declarações
key1=value1,key2=value2,... ondekey1,key2,...podem ser um dos seguintes: arfact, rect, strf (ver abaixo).- arfact
um argumento opcional do tipo real que fornece um fator de escala para a exibição das cabeças das setas no esboço (o valor padrão é 1.0).
- rect
um vetor
rect=[xmin,ymin,xmax,ymax]que fornece as fronteiras da moldura gráfica à ser utilizada.- strf
um string de comprimento 3 "xyz" que possui o mesmo significado do parâmetro
strfdeplot2d. O primeiro caractere não tem efeito comchamp.
Descrição
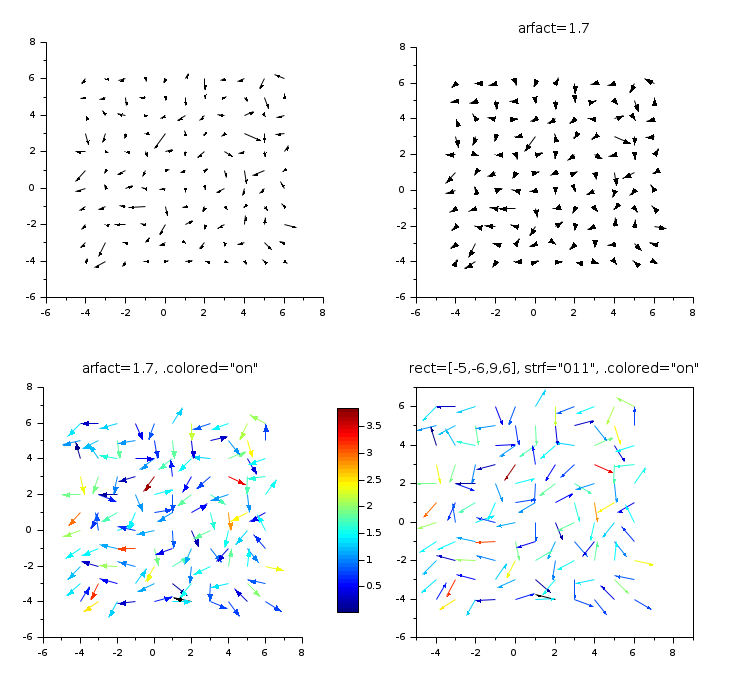
champ(…) plota um campo de vetores 2D com setas.
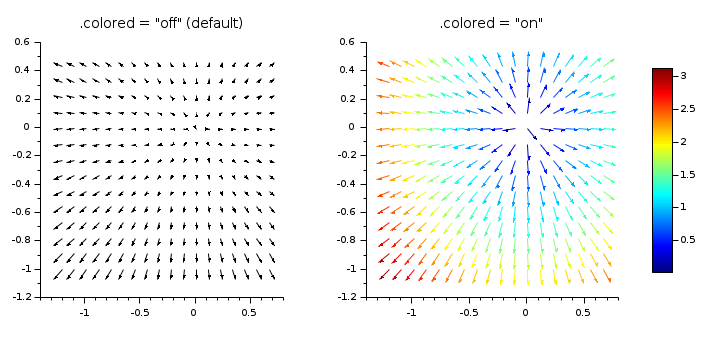
By default, all arrows have the same color, and their length is proportional to the local intensity of the field (norm of vectors). In addition, all lengths are normalized according to the longest arrow.
When setting gce().colored = "on",
each arrow becomes as long as possible in its cell, and is colored
according to the local intensity of the field.
After calling champ(…), gce()
returns the handle of the field of arrows, of type Champ,
whose properties can be post-processed.
Entre com o comando champ() para visualizar um exemplo.
Exemplos
x = -4:6;
X = ndgrid(x);
[fx, fy] =  (rand(X)-0.5, rand(X)-0.5);

clf
gcf().color_map = jetcolormap(50);

// Field's intensity = arrows length
subplot(2,2,1)
champ(x, x, fx, fy)

// With bigger arrow heads
subplot(2,2,2)
champ(x, x, fx, fy, arfact=1.7)
title("arfact=1.7", "fontsize",3)

// Field's intensity = arrows color
xsetech([0 0.5 0.55 0.5])
champ(x, x, fx, fy, arfact=1.7)
gce().colored = "on";
title("arfact=1.7, .colored=""on""", "fontsize",3)
colorbar

// Field's intensity = color, + imposed boundaries
subplot(2,2,4)
champ(x, x, fx, fy, rect=[-5,-6,9,7],strf="011")
gce().colored = "on";
title("rect=[-5,-6,9,6], strf=""011"", .colored=""on""", "fontsize",3)

gcf().axes_size = [740 680];
x = -1.2:0.11:0.7;
y = -1:0.11:0.5;
[X, Y] = ndgrid(x, y);
[fx, fy] = (2*X, 2*Y);

clf
xsetech([0 0 0.45 1])
champ(x, y, fx, fy)
title(".colored = ""off"" (default)", "fontsize",3)
xsetech([0.45 0 0.55 1])
champ(x, y, fx, fy)
title(".colored = ""on""", "fontsize",3)
gce().colored = "on";

gcf().color_map = jetcolormap(100);
colorbar
Ver Também
- champ_properties — Descrição das propriedades da entidade campo vetorial 2d
- fchamp — campo direcional de uma EDO 2d de primeira ordem
- xarrows — desenha um conjunto de setas
- Arrowed polyline — description of the Polyline entity properties
| Report an issue | ||
| << 2d_plot | 2d_plot | champ_properties >> |