Scilab 6.0.0
Please note that the recommended version of Scilab is 2026.0.1. This page might be outdated.
See the recommended documentation of this function
nicholschart
ニコルス線図
呼び出し手順
nicholschart([modules] [,args] [,colors])
引数
- modules
実数ベクトル (モジュール (単位: dB))
- args
r実数ベクトル (位相 (単位: 度))
- colorss
スカラーまたはベクトル, 等ゲインまたは等位相曲線の色インデックス
説明
ニコルス線図をプロット: yの位相/ゲイン平面への
y/(1+y)の等モジュールおよび等引数等高線をプロット
nicholschart は,black
と組み合わせて使用することができます.
modulesおよびargsの
デフォルト値はそれぞれ次のようになります :
[-12 -8 -6 -5 -4 -3 -2 -1.4 -1 -.5 0.25 0.5 0.7 1 1.4 2 2.3 3 4 5 6 8 12]
[-(1:10) , -(20:10:160)]
注意
従来からのnicholschartのニコルス線図の呼び出し手順は以下の形式でした:
nicholschart(modules=gains, args=phases, colors=colors),
しかし,以下の呼び出し手順も利用可能です: nicholschart(gains, phases, colors).
例
//ニコルス線図
clf()
nicholschart(modules=[-6 -3 -1 1 3 6], args=[-1 -20 20 40 80 160 180]);

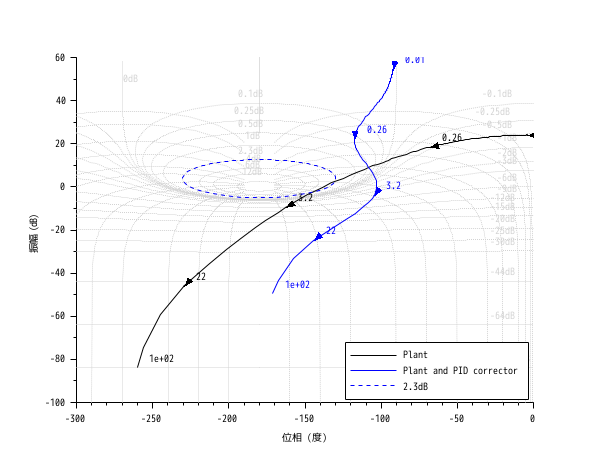
//ニコルス線図のグリッドを付けたブラック図
s=poly(0,'s');
Plant=syslin('c',16000/((s+1)*(s+10)*(s+100)));
// 2自由度PID
tau=0.2;xsi=1.2;
PID=syslin('c',(1/(2*xsi*tau*s))*(1+2*xsi*tau*s+tau^2*s^2));
clf();
black([Plant;Plant*PID ],0.01,100,["Plant";"Plant and PID corrector"]);
// 右下隅にキャプションを移動
ax=gca();Leg=ax.children(1);
Leg.legend_location="in_lower_right";
nicholschart(colors=color('light gray')*[1 1])

履歴
| バージョン | 記述 |
| 5.5.0 | 使用可能な呼び出し手順: nicholschart(gains, phases, colors). |
| Report an issue | ||
| << hallchart | Frequency Domain | nyquist >> |