Scilab 6.0.0
Please note that the recommended version of Scilab is 2026.1.0. This page might be outdated.
See the recommended documentation of this function
gainplot
ゲインプロット
呼び出し手順
gainplot(sl,fmin,fmax [,step] [,comments] )
gainplot(frq,db,phi [,comments])
gainplot(frq, repf [,comments])
引数
- sl
リスト (
syslinSIMO 線形システム).- fmin,fmax
実数スカラー (周波数範囲).
- step
実数 (離散化刻み (対数領域))
- comments
文字列
- frq
行列 (行方向に周波数を並べたもの)
- db,phi
行列 (
frqに対応するゲインと位相)- repf
複素数行列. 各行が各周波数応答に対応.
説明
bode と同じだがゲインのみプロットします.
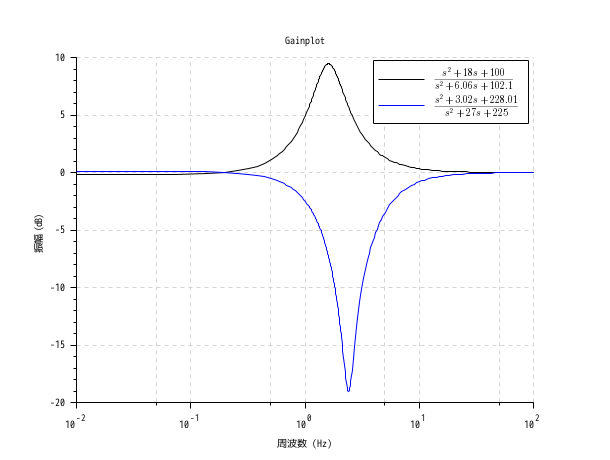
例
s=poly(0,'s')
h1=syslin('c',(s^2+2*0.9*10*s+100)/(s^2+2*0.3*10.1*s+102.01))
h2=syslin('c',(s^2+2*0.1*15.1*s+228.01)/(s^2+2*0.9*15*s+225))
clf();gainplot([h1;h2],0.01,100,..
                   ["$\frac{s^2+18 s+100}{s^2+6.06 s+102.1}$";
                    "$\frac{s^2+3.02 s+228.01}{s^2+27 s+225}$"])
title('Gainplot')
参照
| Report an issue | ||
| << freson | Frequency Domain | hallchart >> |