- Aide de Scilab
- CACSD (Computer Aided Control Systems Design)
- Représentations formelles et conversions
- Plot and display
- noisegen
- pol2des
- syslin
- abinv
- arhnk
- arl2
- arma
- arma2p
- arma2ss
- armac
- armax
- armax1
- arsimul
- augment
- balreal
- bilin
- bstap
- cainv
- calfrq
- canon
- ccontrg
- cls2dls
- colinout
- colregul
- cont_mat
- contr
- contrss
- copfac
- csim
- ctr_gram
- damp
- dcf
- ddp
- dhinf
- dhnorm
- dscr
- dsimul
- dt_ility
- dtsi
- equil
- equil1
- feedback
- findABCD
- findAC
- findBD
- findBDK
- findR
- findx0BD
- flts
- fourplan
- freq
- freson
- fspec
- fspecg
- fstabst
- g_margin
- gamitg
- gcare
- gfare
- gfrancis
- gtild
- h2norm
- h_cl
- h_inf
- h_inf_st
- h_norm
- hankelsv
- hinf
- imrep2ss
- inistate
- invsyslin
- kpure
- krac2
- lcf
- leqr
- lft
- lin
- linf
- linfn
- linmeq
- lqe
- lqg
- lqg2stan
- lqg_ltr
- lqr
- ltitr
- macglov
- minreal
- minss
- mucomp
- narsimul
- nehari
- nyquistfrequencybounds
- obs_gram
- obscont
- observer
- obsv_mat
- obsvss
- p_margin
- parrot
- pfss
- phasemag
- plzr
- ppol
- prbs_a
- projsl
- repfreq
- ric_desc
- ricc
- riccati
- routh_t
- rowinout
- rowregul
- rtitr
- sensi
- sident
- sorder
- specfact
- ssprint
- st_ility
- stabil
- sysfact
- syssize
- time_id
- trzeros
- ui_observer
- unobs
- zeropen
Please note that the recommended version of Scilab is 2026.1.0. This page might be outdated.
See the recommended documentation of this function
g_margin
gain margin and associated crossover frequency
Calling Sequence
gm=g_margin(h)
[gm,fr]=g_margin(h)
Arguments
- h
a SISO linear system (see :syslin).
- gm
a number, the gain margin (in dB) if any of
Inf- fr
a number, the associated frequency in hertz, or an empty matrix if the gain margin does not exist.
Description
Given a SISO linear system in continuous or discrete time,
g_margin returns gm, the
gain margin in dB of h and
fr, the achieved corresponding frequency in
Hz.
The gain margin, if it exists, is the minimal value of the
system gain at points where the nyquist plot crosses the negative
real axis. In other words the gain margin is
20*log10(1/g) where g is the
open loop gain of h when the frequency response
phase of h equals -180°
The algorithm uses polynomial root finder to solve the equations:
- h(s)=h(-s)
for the continuous time case.
- h(z)=h(1/z)
for the discrete time case.
Examples
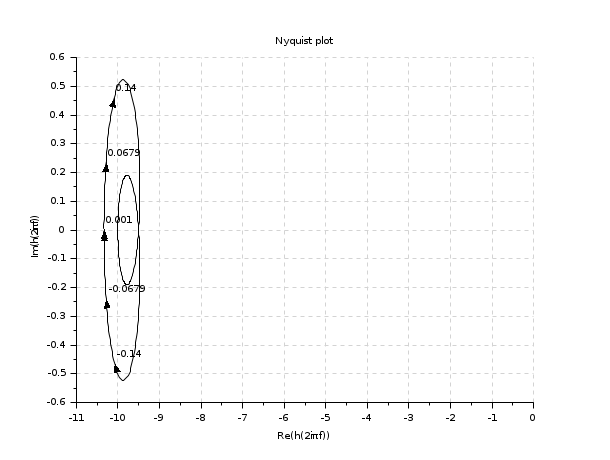
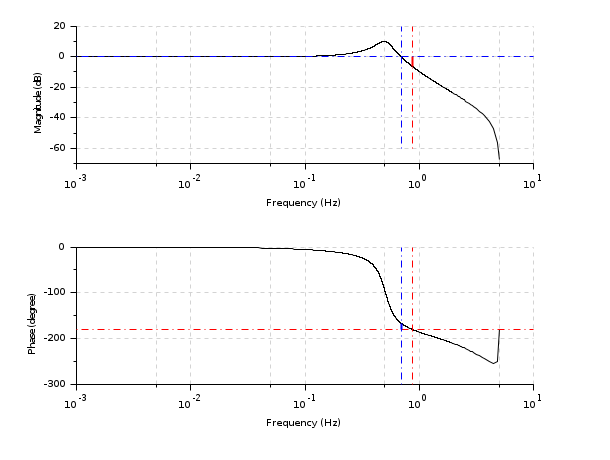
h=syslin('c',-1+%s,3+2*%s+%s^2) //continuous time case
[g,fr]=g_margin(h)
[g,fr]=g_margin(h-10)
nyquist(h-10)
h = syslin(0.1,0.04798*%z+0.0464,%z^2-1.81*%z+0.9048);//discrete time case
[g ,fr]=g_margin(h);
show_margins(h)
See Also
- p_margin — phase margin and associated crossover frequency
- show_margins — display gain and phase margin and associated crossover frequencies
- repfreq — frequency response
- black — Black-Nichols diagram of a linear dynamical system
- bode — Bode plot
- nicholschart — Nichols chart
- nyquist — nyquist plot
| Report an issue | ||
| << fstabst | CACSD (Computer Aided Control Systems Design) | gamitg >> |