- Scilab help
- Graphics
- 2d_plot
- 3d_plot
- annotation
- axes_operations
- axis
- bar_histogram
- Color management
- Datatips
- figure_operations
- geometric_shapes
- handle
- interaction
- load_save
- pie
- polygon
- property
- style
- text
- transform
- window_control
- GlobalProperty
- Graphics: Getting started
- alufunctions
- clear_pixmap
- Compound_properties
- graphics_entities
- object_editor
- pixel_drawing_mode
- plzr
- rubberbox
- segs_properties
- show_pixmap
- square
- twinkle
- xbasr
- xchange
- xclear
- xdel
- xget
- xgetech
- xgraduate
- xgrid
- xname
- xnumb
- xpause
- xsegs
- xset
- xsetech
- xsetm
Please note that the recommended version of Scilab is 2026.0.1. This page might be outdated.
See the recommended documentation of this function
xsegs
接続されていない線分を描画
呼び出し手順
xsegs(xv,yv,[style])
xsegs(xv,yv,zv,[style])
引数
- xv, yv, zv
同じ大きさの行列.
zvが指定されない場合, ゼロベクトルを使用します.- style
ベクトルまたはスカラー.
styleが正のスカラーの場合, 全ての線分で使用される色を指定します.styleが負のスカラーの場合 , カレントの色が使用されます.styleがベクトルの場合,style(i)は線分iに関する 色を指定します.
説明
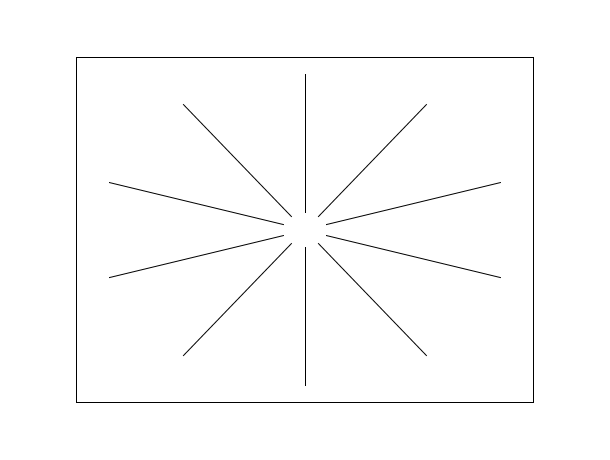
xsegs は
xv, yv および zv
で指定した接続されていない一連の線分を描画します.
xv, yv および zv
が行列の場合,列を結合したベクトルとみなされます.
ある線分を定義する2つ点の座標は
xv, yv および
zvの連続する2つの値で指定されます:
(xv(i),yv(i),zv(i))-->(xv(i+1),yv(i+1),zv(i+1)).
例えば, 大きさ (2,n)の行列の場合, 線分は以下のように定義されます:
xv=[xi_1 xi_2 ...; xf_1 xf_2...]
yv=[yi_1 yi_2 ...; yf_1 yf_2...]
zv=[zi_1 zi_2 ...; zf_1 zf_2...]
そして,線分は (xi_k,yi_k,zi_k)-->(xf_k,yf_k,zf_k)となります.
例

例
// 2次元の例
x=2*%pi*(0:9)/10;
xv=[sin(x);9*sin(x)];
yv=[cos(x);9*cos(x)];
plot2d([-10,10],[-10,10],[-1,-1],"022")
xsegs(xv,yv,1:10)
// 2次元の例
plot2d([-10,10],[-10,10],[-1,-1],"022")
xsegs([9, -9],[9 , -9]) //  X(9,9) から Y(-9, -9) に線を引く
xsegs([5, -2],[4 , -1]) //  X(5,4) から Y(-2, -1) に線を引く
// 3次元の例
clf();
a=gca();
a.view="3d";
f=gcf();
f.color_map=rainbowcolormap(120);
alpha=2*%pi*(0:119)/40;
xv=[sin(alpha)/2;sin(alpha)/3];
yv=[cos(alpha)/2;cos(alpha)/3];
zv=[alpha/8;alpha/8];
xsegs(xv,yv,zv,1:120);
// Now adjust the data_bounds
a.data_bounds = [min(xv) min(yv) min(zv); ...
                 max(xv) max(yv) max(zv)];
// 矢印を各線分に追加できます
e = gce();
e.arrow_size = 0.4;
| Report an issue | ||
| << xpause | Graphics | xset >> |