- Scilab help
- Graphics
- 2d_plot
- 3d_plot
- annotation
- axes_operations
- axis
- bar_histogram
- Color management
- Datatips
- figure_operations
- geometric_shapes
- handle
- interaction
- load_save
- pie
- polygon
- property
- style
- text
- transform
- window_control
- GlobalProperty
- Graphics: Getting started
- alufunctions
- clear_pixmap
- Compound_properties
- graphics_entities
- object_editor
- pixel_drawing_mode
- plzr
- rubberbox
- segs_properties
- show_pixmap
- square
- twinkle
- xbasr
- xchange
- xclear
- xdel
- xget
- xgetech
- xgraduate
- xgrid
- xname
- xnumb
- xpause
- xsegs
- xset
- xsetech
- xsetm
Please note that the recommended version of Scilab is 2026.1.0. This page might be outdated.
See the recommended documentation of this function
xsegs
draw unconnected segments
Calling Sequence
xsegs(xv,yv,[style])
xsegs(xv,yv,zv,[style])
Arguments
- xv, yv, zv
matrices of the same size. If
zvis not specified, a zero vector is used.- style
vector or scalar. If
styleis a positive scalar, it gives the color to use for all segments. Ifstyleis a negative scalar, then current color is used. Ifstyleis a vector, thenstyle(i)gives the color to use for segmenti.
Description
xsegs draws a set of unconnected segments given by
xv, yv and zv.
If xv, yv and zv are matrices they are considered as vectors by
concatenating their columns. The coordinates of the two points defining a
segment are given by two consecutive values of xv, yv and
zv:
(xv(i),yv(i),zv(i))-->(xv(i+1),yv(i+1),zv(i+1)).
For instance, using matrices of size (2,n), the segments can be defined by:
xv=[xi_1 xi_2 ...; xf_1 xf_2...]
yv=[yi_1 yi_2 ...; yf_1 yf_2...]
zv=[zi_1 zi_2 ...; zf_1 zf_2...]
and the segments are (xi_k,yi_k,zi_k)-->(xf_k,yf_k,zf_k).
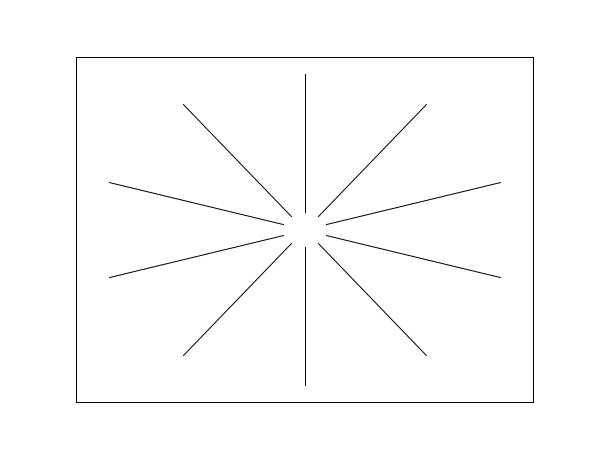
Examples
// 2D example
x=2*%pi*(0:9)/10;
xv=[sin(x);9*sin(x)];
yv=[cos(x);9*cos(x)];
plot2d([-10,10],[-10,10],[-1,-1],"022")
xsegs(xv,yv,1:10)
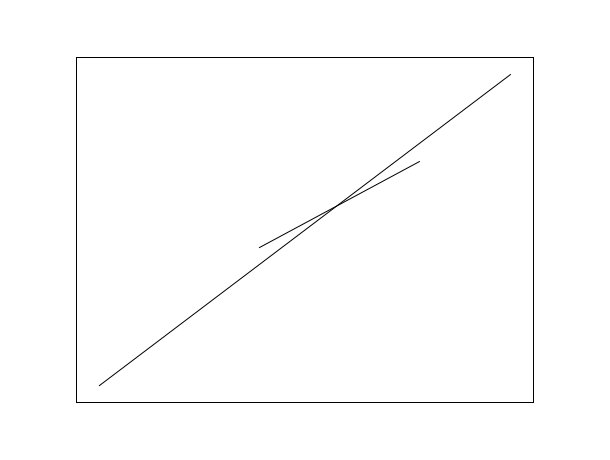
// 2D example
plot2d([-10,10],[-10,10],[-1,-1],"022")
xsegs([9, -9],[9 , -9]) // Draw the line from X(9,9) to Y(-9, -9)
xsegs([5, -2],[4 , -1]) // Draw the line from X(5,4) to Y(-2, -1)
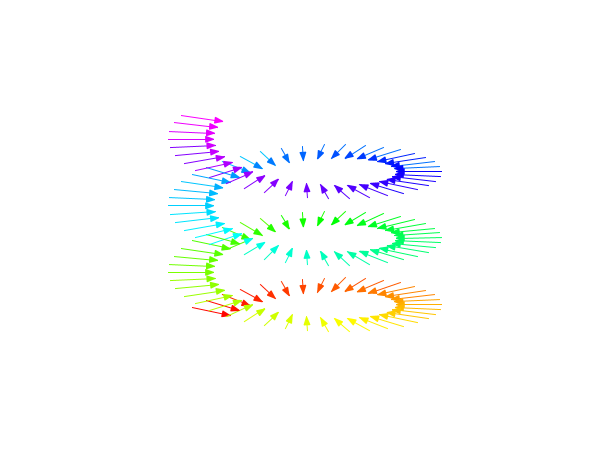
// 3D example
clf();
a=gca();
a.view="3d";
f=gcf();
f.color_map=rainbowcolormap(120);
alpha=2*%pi*(0:119)/40;
xv=[sin(alpha)/2;sin(alpha)/3];
yv=[cos(alpha)/2;cos(alpha)/3];
zv=[alpha/8;alpha/8];
xsegs(xv,yv,zv,1:120);
// Now adjust the data_bounds
a.data_bounds = [min(xv) min(yv) min(zv); ...
                 max(xv) max(yv) max(zv)];
// We can add an arrow to each segs
e = gce();
e.arrow_size = 0.4;
| Report an issue | ||
| << xpause | Graphics | xset >> |