Scilab 5.4.0
- Scilab help
- Graphics
- 2d_plot
- 3d_plot
- annotation
- axes_operations
- axis
- bar_histogram
- Color management
- Datatips
- figure_operations
- geometric_shapes
- handle
- interaction
- load_save
- pie
- polygon
- property
- style
- text
- transform
- window_control
- GlobalProperty
- Graphics: Getting started
- alufunctions
- clear_pixmap
- Compound_properties
- graphics_entities
- object_editor
- pixel_drawing_mode
- plzr
- rubberbox
- segs_properties
- show_pixmap
- square
- twinkle
- xbasr
- xchange
- xclear
- xdel
- xget
- xgetech
- xgraduate
- xgrid
- xname
- xnumb
- xpause
- xsegs
- xset
- xsetech
- xsetm
Please note that the recommended version of Scilab is 2026.1.0. This page might be outdated.
See the recommended documentation of this function
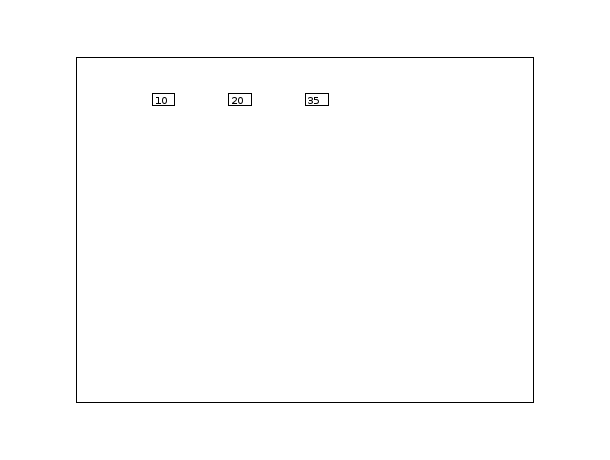
xnumb
draw numbers
Calling Sequence
xnumb(x,y,nums,[box,angle])
Arguments
- x,y,nums
vectors of same size.
- box
integer value.
- angle
optional vector of same size as
x
Description
xnumb draws the value of nums(i)
at position x(i),y(i) in the current scale.
If box is 1, a box is drawn around the numbers.
If angle is given, it gives the direction for string drawing.
See Also
- xstring — draw strings
| Report an issue | ||
| << xname | Graphics | xpause >> |