colormaps
カラーマップを定義
説明
カラーマップ cmap はm x 3行列で定義されます.
m は色の数です.
色番号 i は, それぞれ赤, 緑, 青の彩度(範囲は0から1)を表す
cmap(i,1), cmap(i,2),
cmap(i,3) の組で指定されます.
最初,カラーマップには32種類の色が定義されています.
特定の図のカラーマップを set(f,"color_map",cmap)
により変更することが可能です.
ただし, fは図のハンドルです.
カラーマップの各色は,多くのプロット関数で色を指定するために使用する 際に使用されるIDを有しています. このIDを参照するには,関数getcolor を使用してください.
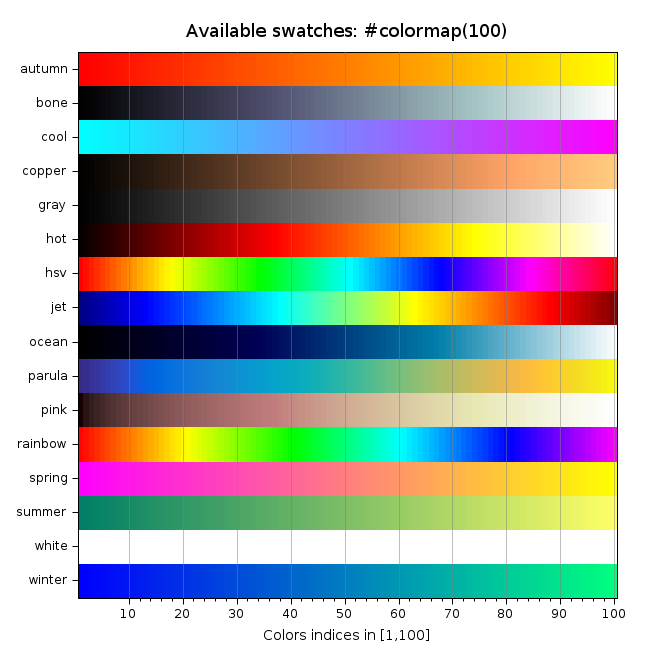
A set of functions from autumn(n) to winter(n) provide swatches that can be set to colormaps. They are illustrated here-below.
The colormap of the current figure can be retrieved with cmap = gcf().color_map.
The current default colormap can be retrieved with cmap = gdf().color_map.
The factory default colormap can be retrieved with cmap = sdf().color_map.
Sample

例
n = 64;
r = linspace(0,1,n)';
g = linspace(1,0,n)';
b = ones(r);
cmap = [r g b];
f = gcf(); f.color_map = cmap;
plot3d1()
f.color_map = gdf().color_map; // restores to the default colormap
gdf().color_map
--> gdf().color_map
 ans  =
   0.          0.          0.
   0.          0.          1.
   0.          1.          0.
   0.          1.          1.
   1.          0.          0.
   1.          0.          1.
   1.          1.          0.
   1.          1.          1.
   0.          0.          0.5647059
   0.          0.          0.6901961
   0.          0.          0.8156863
   0.5294118   0.8078431   1.
   0.          0.5647059   0.
   0.          0.6901961   0.
   0.          0.8156863   0.
   0.          0.5647059   0.5647059
   0.          0.6901961   0.6901961
   0.          0.8156863   0.8156863
   0.5647059   0.          0.
   0.6901961   0.          0.
   0.8156863   0.          0.
   0.5647059   0.          0.5647059
   0.6901961   0.          0.6901961
   0.8156863   0.          0.8156863
   0.5019608   0.1882353   0.
   0.627451    0.2509804   0.
   0.7529412   0.3764706   0.
   1.          0.5019608   0.5019608
   1.          0.627451    0.627451
   1.          0.7529412   0.7529412
   1.          0.8784314   0.8784314
   1.          0.8431373   0.
参照
| Report an issue | ||
| << colormap | colormaps | Predefined colormaps >> |