getcolor
カレントのカラーマップの色を示すダイアログをオープンする
呼び出し手順
c = getcolor()
c = getcolor(title)
c = getcolor(title, cini)
引数
- title
文字列, ダイアログのタイトル.
- cini
選択された初期値の色ID.デフォルト値はs 1.
- c
選択された色IDまたは 選択がキャンセルされた場合に [].
説明
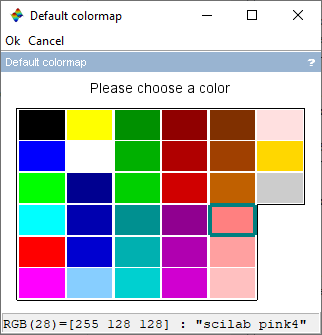
getcolor はカレントのカラーマップのパレットを表示する
ウインドウをオープンします.
ユーザはそのIDとRGB値を表示するために色をクリックすることができます.
getcolor は選択された色のID,または
"Cancel"ボタンがクリックされたかウインドウがクローズされた場合に []を返します.
例
c = getcolor();
c = getcolor("Title foo", color("red")); // 赤を選択
c = getcolor("Please choose a color");

--> c = getcolor("Please choose a color")
 c  =
   28.
参照
- uigetcolor — 色を選択するダイアログを開く.
- color_list — 色の名前のリスト
- color — 色の色IDを取得
- colormap — set and/or get a figure colormap.
| Report an issue | ||
| << colorbar | Color management | hsv2rgb >> |