Using colormaps
Using colormaps in graphics.
Description
A colormap cmap is defined by a m x 3 matrix of Red, Green and Blue
colors intensities in the [0,1] interval. m is the number of colors defined in the colormap.
The color number i is given in the ith row as a 3-uple cmap(i,1),
cmap(i,2), cmap(i,3). For a given colormap,
this index i identifies the color.
The default colormap contains 32 colors. You can
change the colormap of a figure by using f.color_map=cmap
where f is the handle of the figure.
Each color in the colormap has an index you have to use to specify color in most plot functions. To see the indices, use function getcolor.
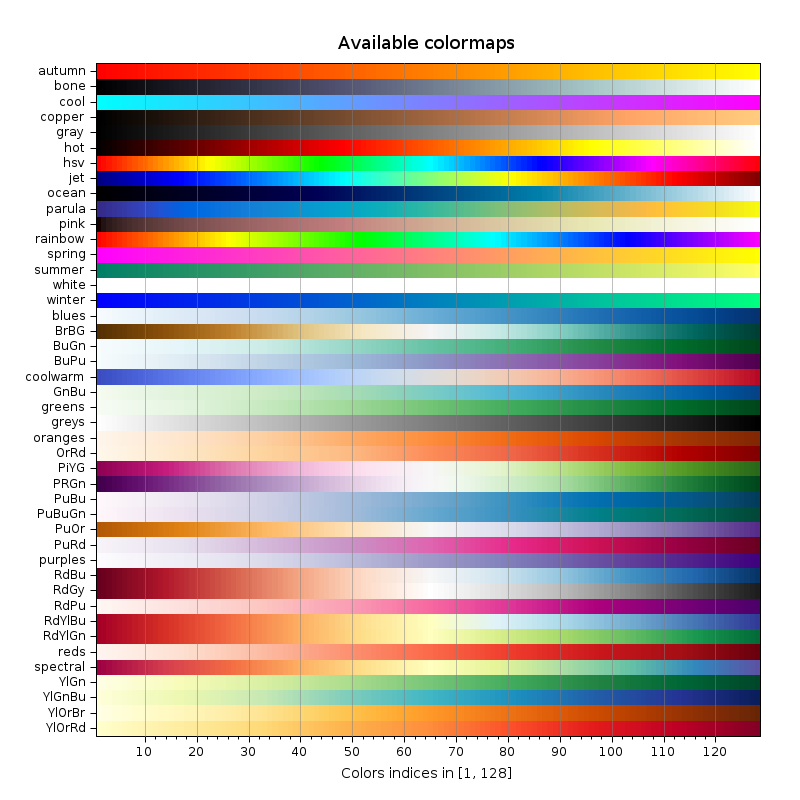
A set of pre-defined colormaps is provided with Scilab. They are illustrated here-below.
The colormap of the current figure can be retrieved with cmap = gcf().color_map.
The current default colormap can be retrieved with cmap = gdf().color_map.
Sample

Examples
n = 64;
r = linspace(0,1,n)';
g = linspace(1,0,n)';
b = ones(r);
cmap = [r g b];
f = gcf(); f.color_map = cmap;
plot3d1()
f.color_map = gdf().color_map; // restores to the default colormap
gdf().color_map
--> gdf().color_map
 ans  =
   0.          0.          0.
   0.          0.          1.
   0.          1.          0.
   0.          1.          1.
   1.          0.          0.
   1.          0.          1.
   1.          1.          0.
   1.          1.          1.
   0.          0.          0.5647059
   0.          0.          0.6901961
   0.          0.          0.8156863
   0.5294118   0.8078431   1.
   0.          0.5647059   0.
   0.          0.6901961   0.
   0.          0.8156863   0.
   0.          0.5647059   0.5647059
   0.          0.6901961   0.6901961
   0.          0.8156863   0.8156863
   0.5647059   0.          0.
   0.6901961   0.          0.
   0.8156863   0.          0.
   0.5647059   0.          0.5647059
   0.6901961   0.          0.6901961
   0.8156863   0.          0.8156863
   0.5019608   0.1882353   0.
   0.627451    0.2509804   0.
   0.7529412   0.3764706   0.
   1.          0.5019608   0.5019608
   1.          0.627451    0.627451
   1.          0.7529412   0.7529412
   1.          0.8784314   0.8784314
   1.          0.8431373   0.
See also
| Report an issue | ||
| << colormap | Palettes de couleurs | Predefined colormaps >> |