Graphics: Getting started
graphics library overview
2d plotting
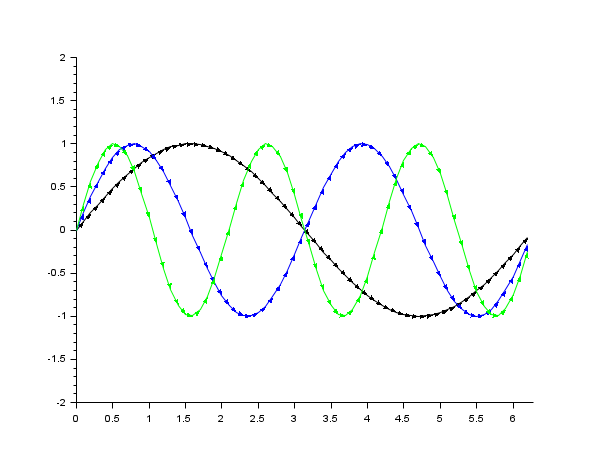
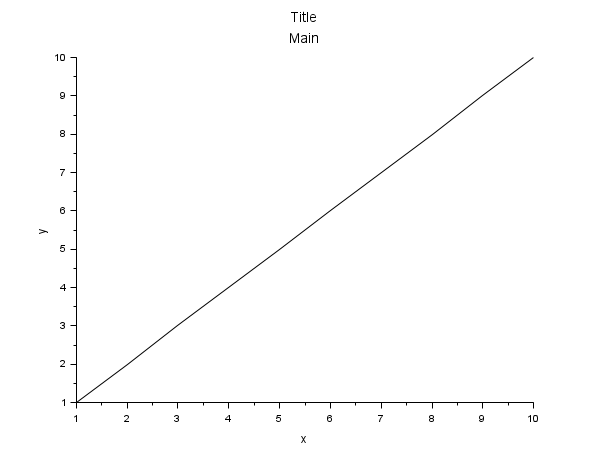
- plot2d
Plot a curve
Example:
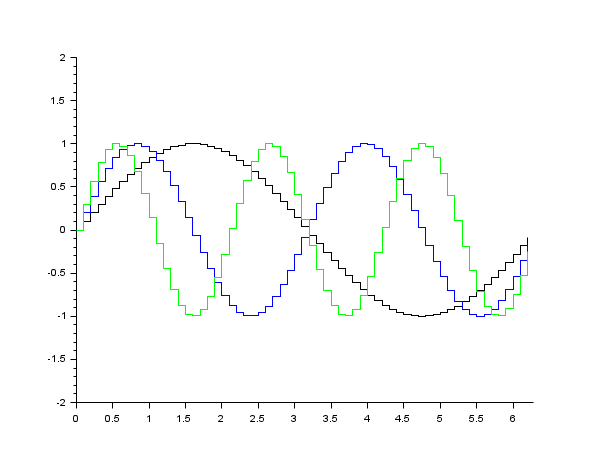
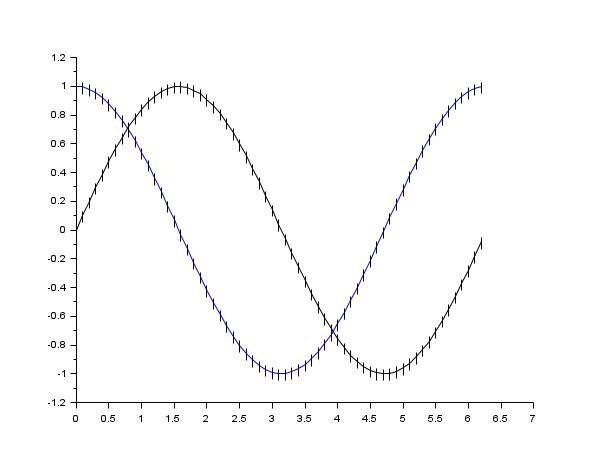
- plot2d2
Plot a curve as step function
Example:
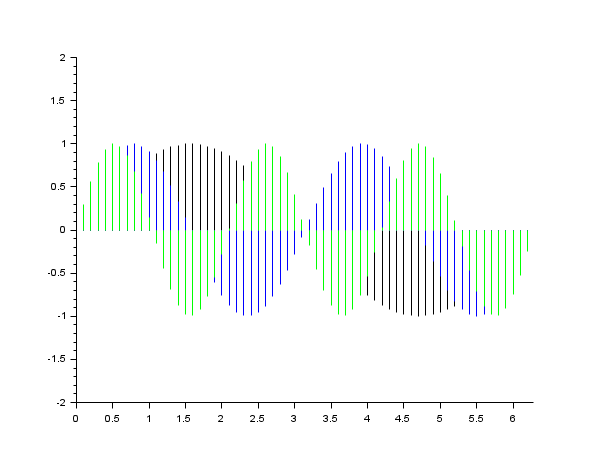
- plot2d3
Plot a curve with vertical bars
Example:
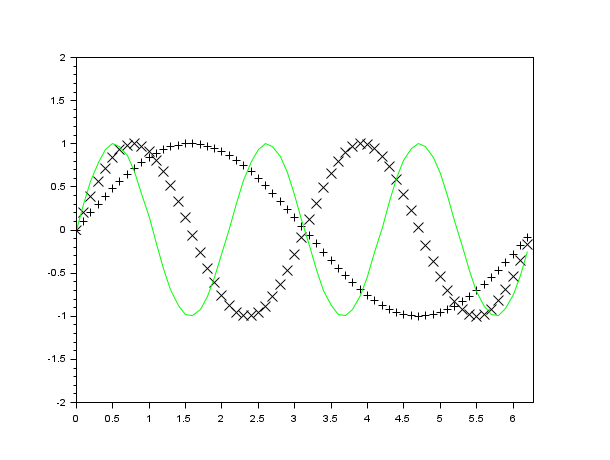
- plot2d4
Plot a curve with arrows
Example:
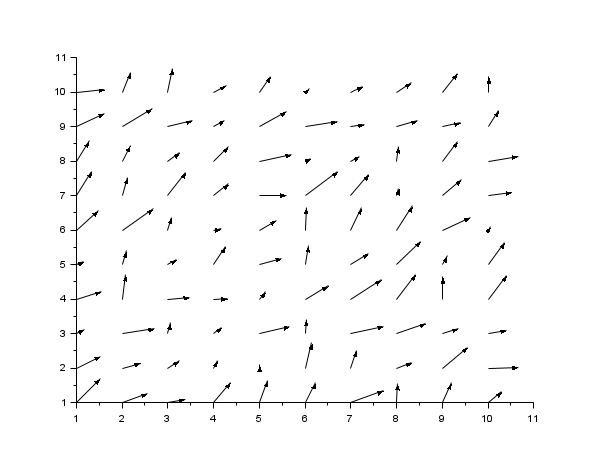
- champ
2D vector field
Example:
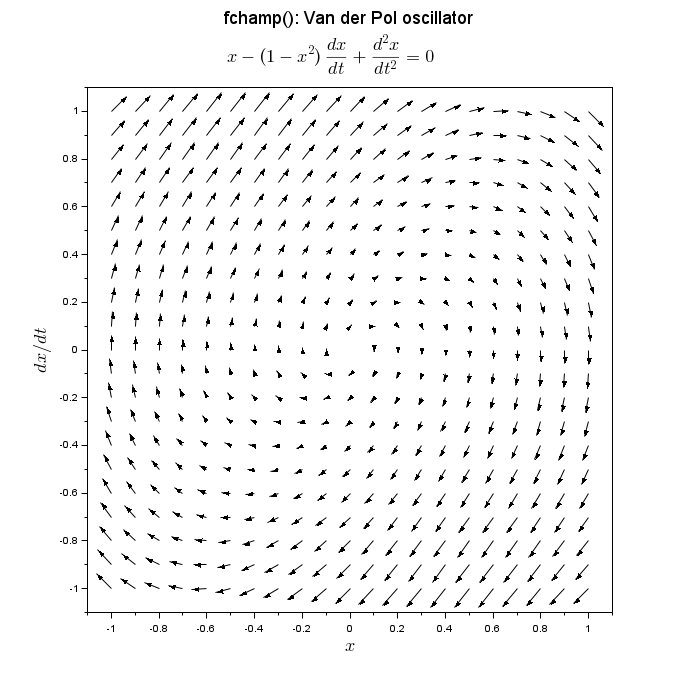
- fchamp
Direction field of a 2D first order ODE
Example:
- contour2d
Level curves of a surface on a 2D plot
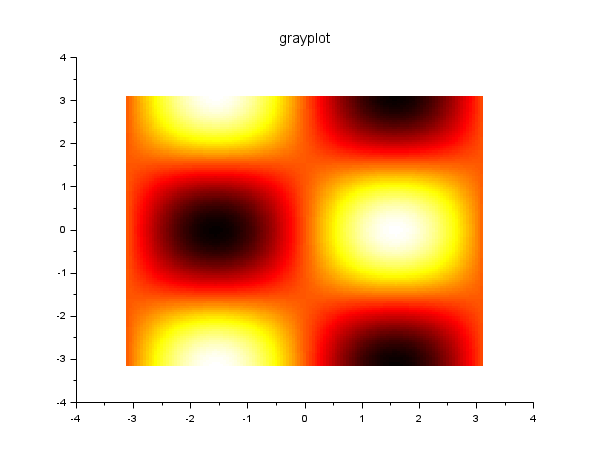
- grayplot
2D plot of a surface using colors
Example:
- fgrayplot
2D plot of a surface defined by a function using colors
Example:
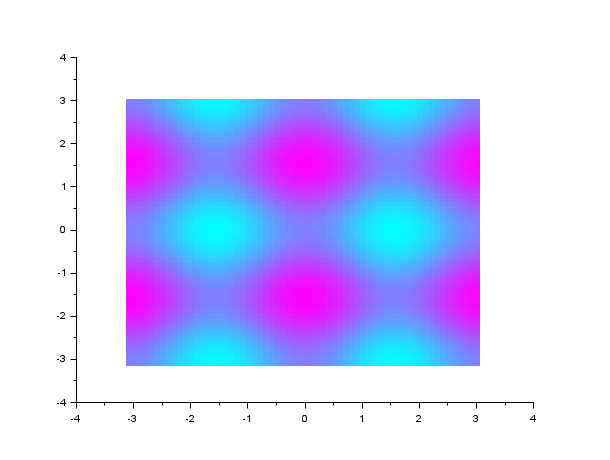
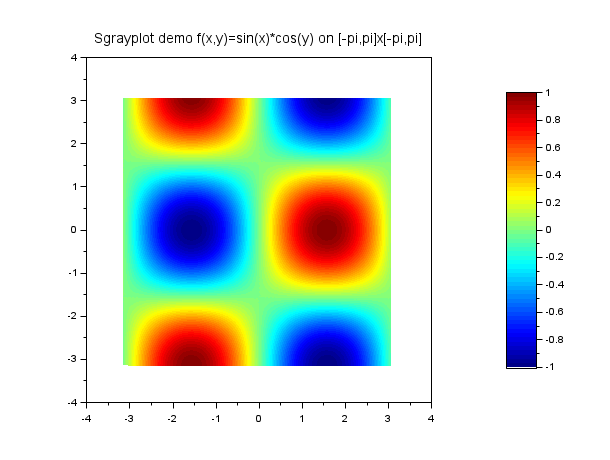
- Sgrayplot
Smooth 2D plot of a surface using colors
Example:
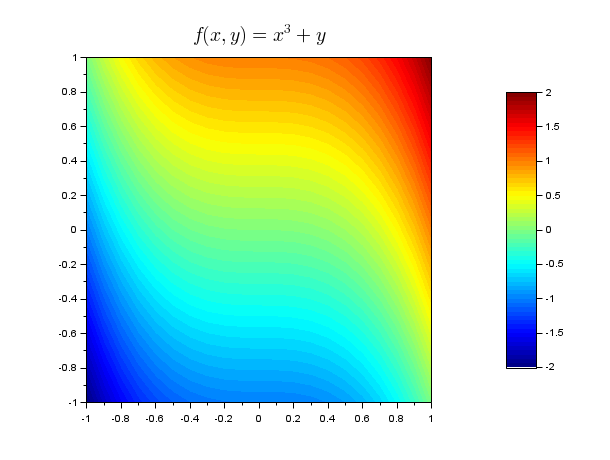
- Sfgrayplot
Smooth 2D plot of a surface defined by a function using colors
Example:
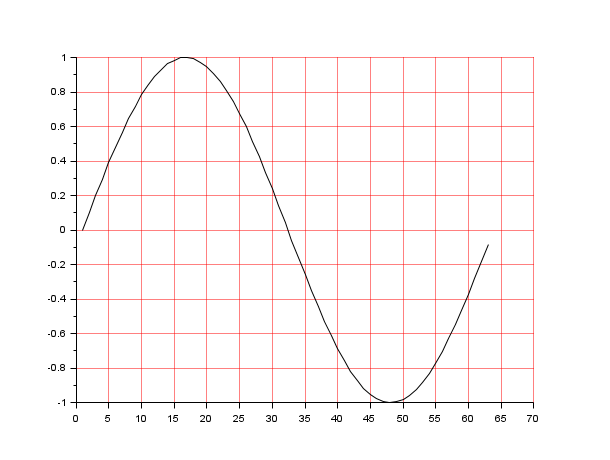
- xgrid
Add a grid on a 2D plot
Example:
- errbar
Add vertical error bars on a 2D plot
Example:
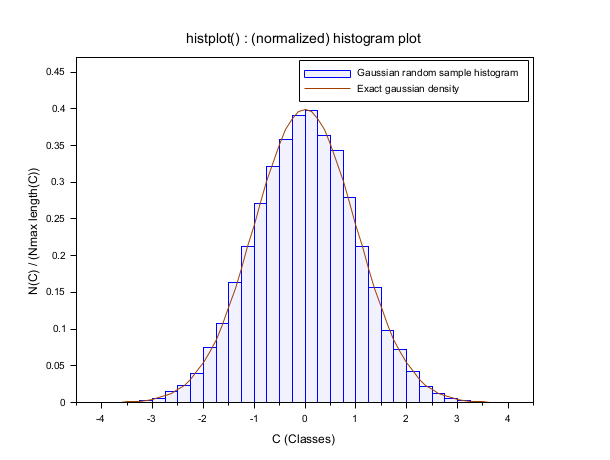
- histplot
Plot a histogram
Example:
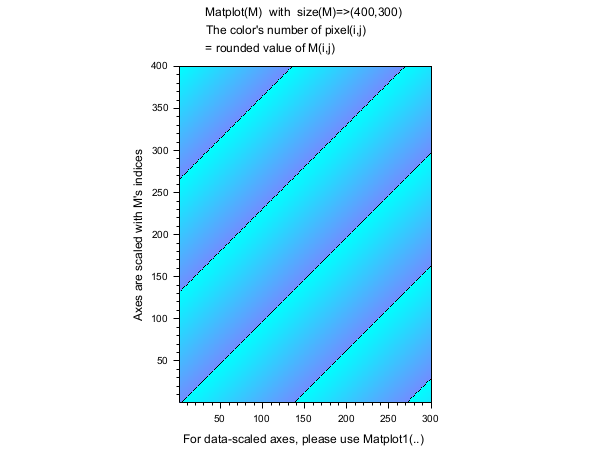
- Matplot
2D plot of a matrix using colors
Example:
3d plotting
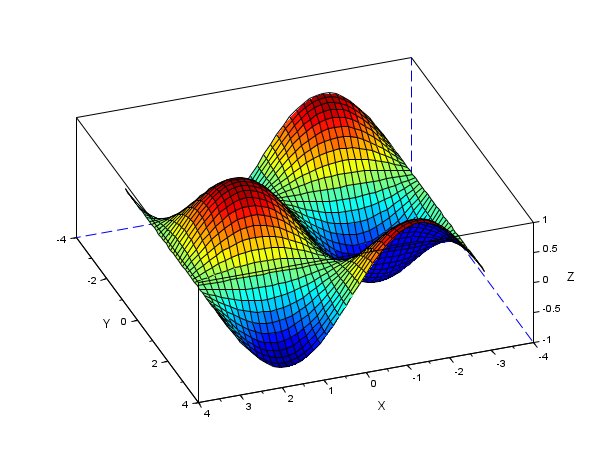
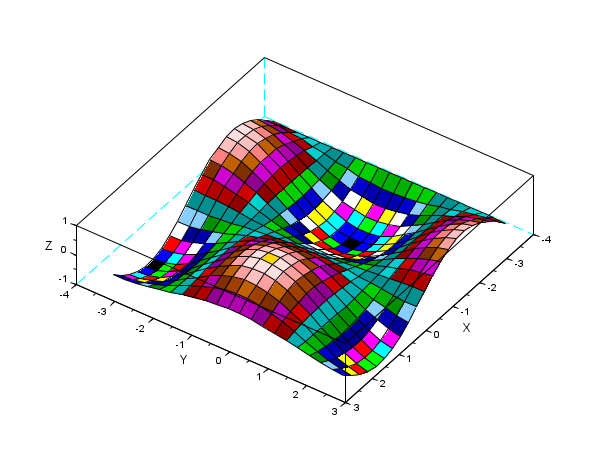
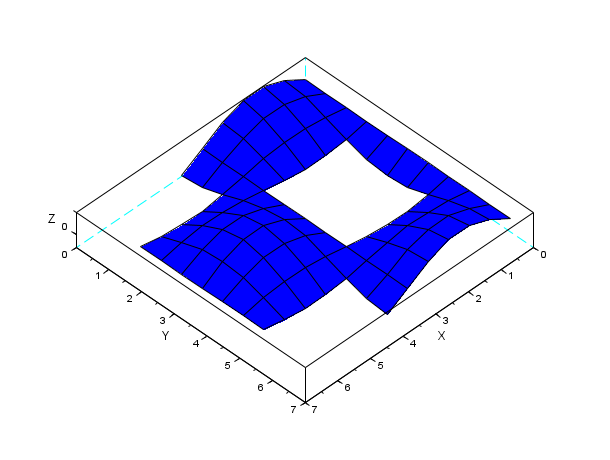
- plot3d
Plot a surface
Example:
- plot3d1
Plot a surface with gray or color level
Example:

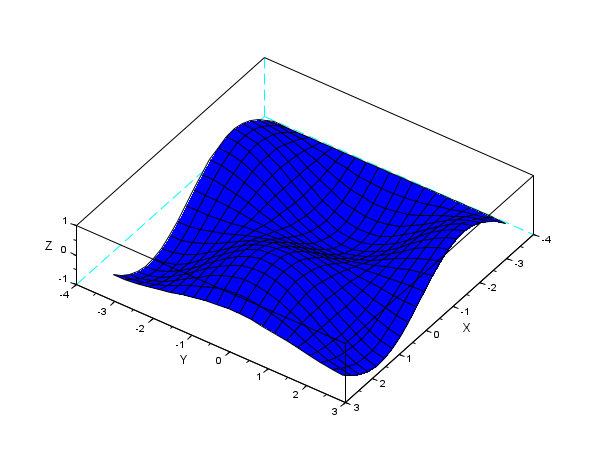
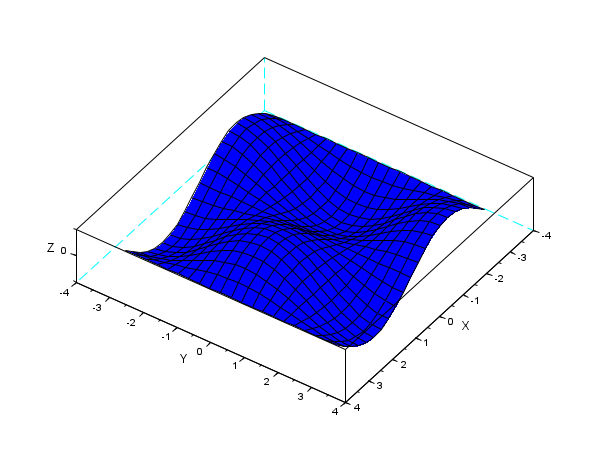
- fplot3d
Plot a surface defined by a function
Example:
- fplot3d1
Plot a surface defined by a function with gray or color level
Example:
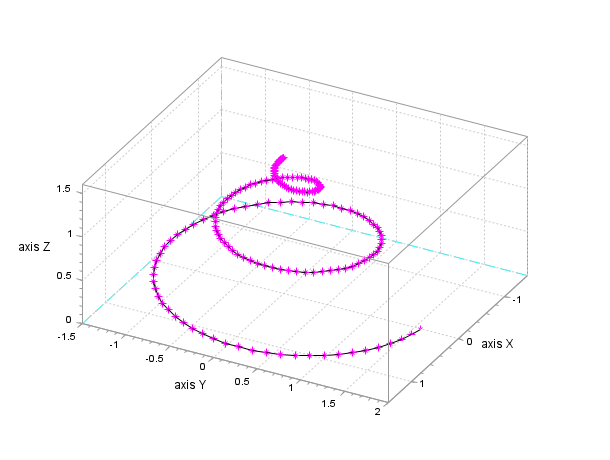
- param3d
Plot one curve
Example:
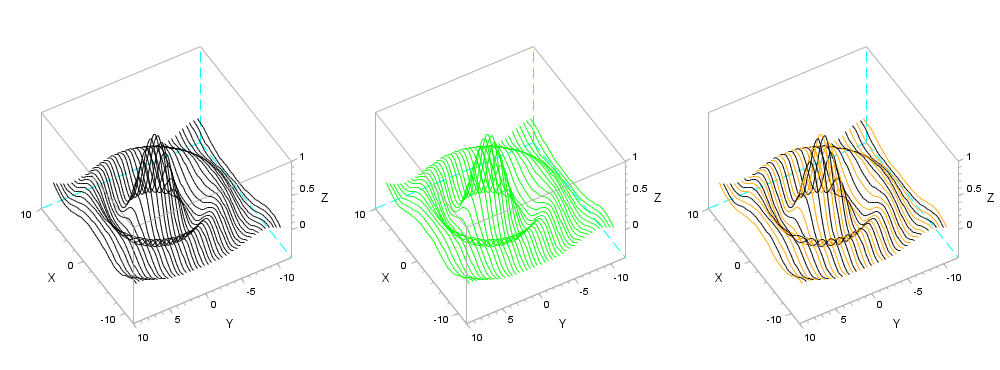
- param3d1
Plots curves
Example:
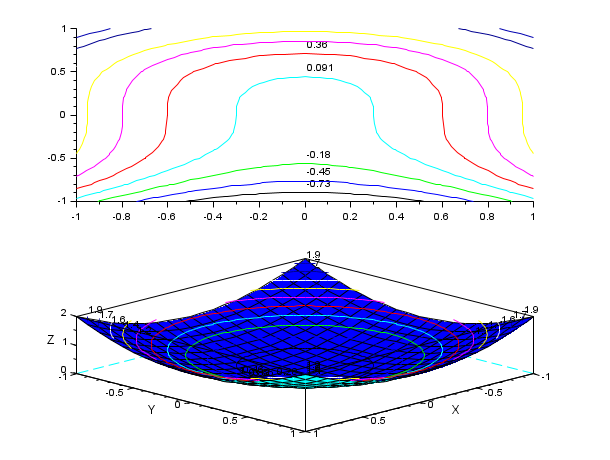
- contour
Level curves on a 3D surface
Example:
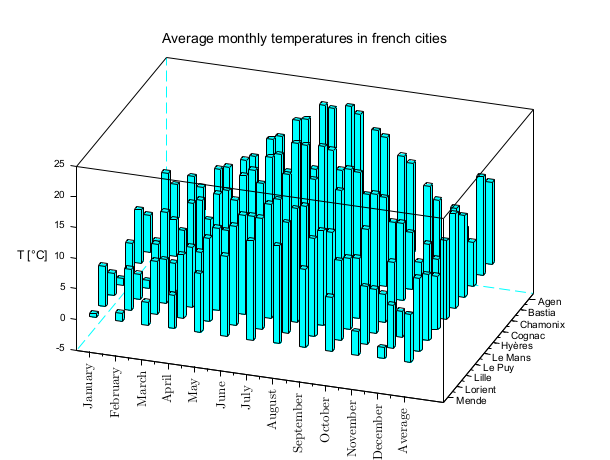
- bar3d
3D representation of a bar diagram
Example:
- genfac3d
Compute facets of a 3D surface
Example:
- eval3dp
Compute facets of a 3D surface
Example:
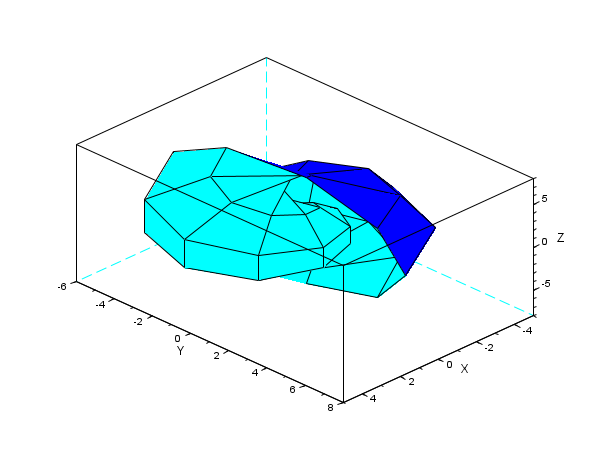
- geom3d
Projection from 3D on 2D after a 3D plot
Example:
Line and polygon plotting
Rectangle plotting
Arc plotting
Arrow plotting
- xarrows
Draw a set of arrows
Strings
Coordinates transformations
Colors
Graphics context
Save and load
- xsave
Save graphics into a file
- xload
Load a saved graphics
- xs2bmp
Export graphics using the BMP format
- xs2emf
Export graphics using the EMF format

Only under Windows.
- xs2eps
Export graphics using the EPS format
- xs2gif
Export graphics using the GIF format
- xs2jpg
Export graphics using the JPG format
- xs2pdf
Export graphics using the PDF format
- xs2png
Export graphics using the PNG format
- xs2ppm
Export graphics using the PPM format
- xs2ps
Export graphics using the PS format
- xs2svg
Export graphics using the SVG format
Graphics primitives
- clf
Clear or reset the current graphic figure (window) to default values
- driver
Select a graphics driver
- xinit
Initialisation of a graphics driver
- xend
Close a graphics session
- replot
Redraw the current graphics window with new boundaries
- show_window
Raise the current graphics window
- close
Close some graphic windows
- winsid
Return the list of graphics windows
Mouse position
Interactive editor
- edit_curv
Interactive graphics curve editor
Graphics functions for automatic control
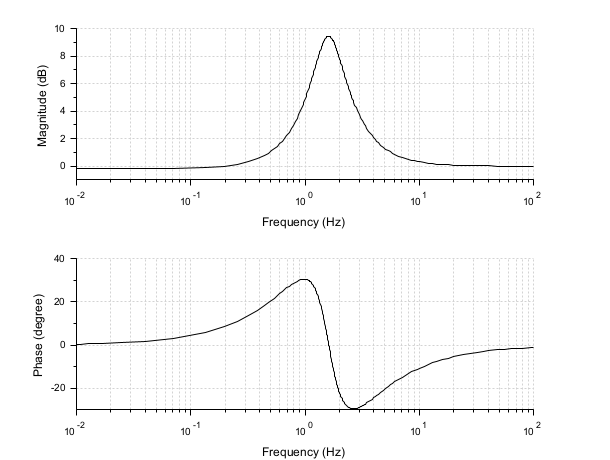
- bode
Bode plot
Example:
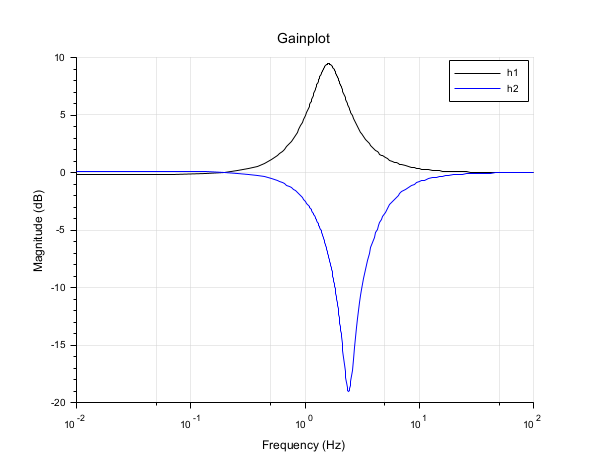
- gainplot
Magnitude plot
Example:
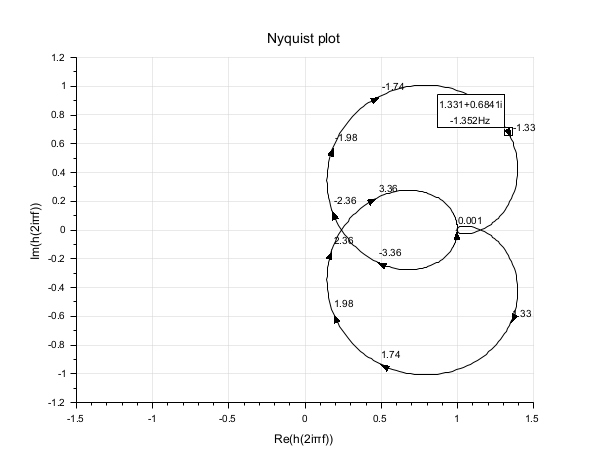
- nyquist
Nyquist plot
Example:
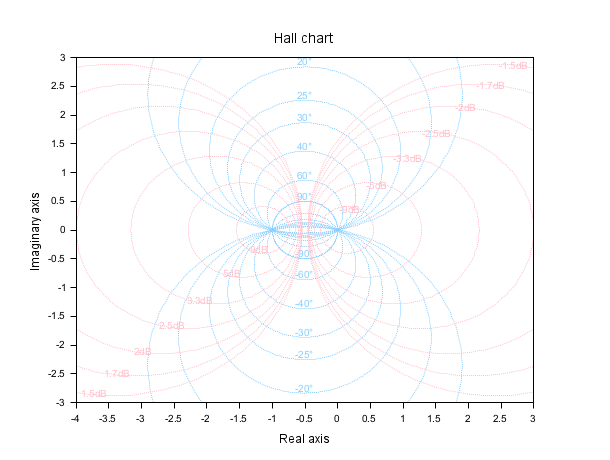
- hallchart
Hall chart
Example:
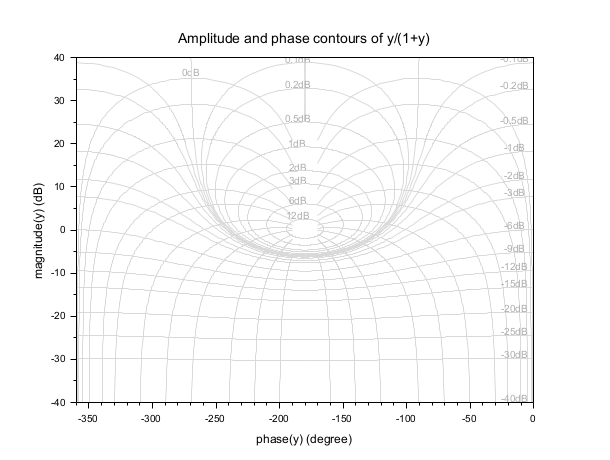
- nicholschart
Nichols chart
Example:
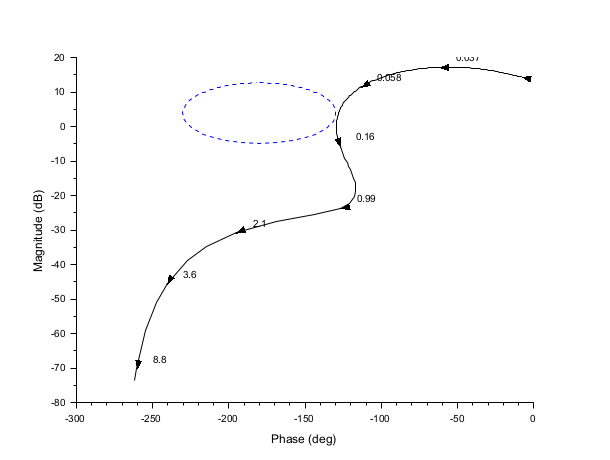
- black
Black's diagram
Example:
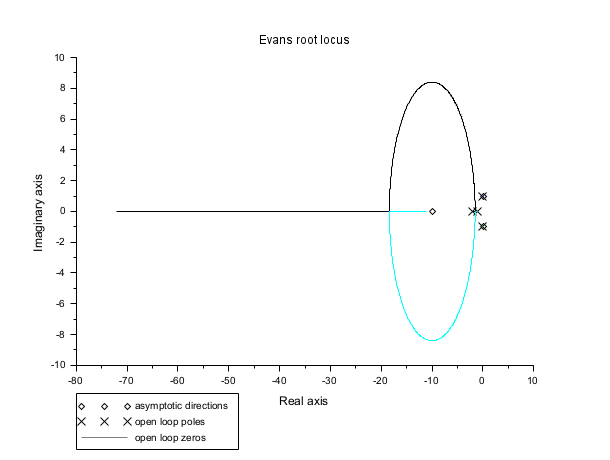
- evans
Evans root locus
Example:
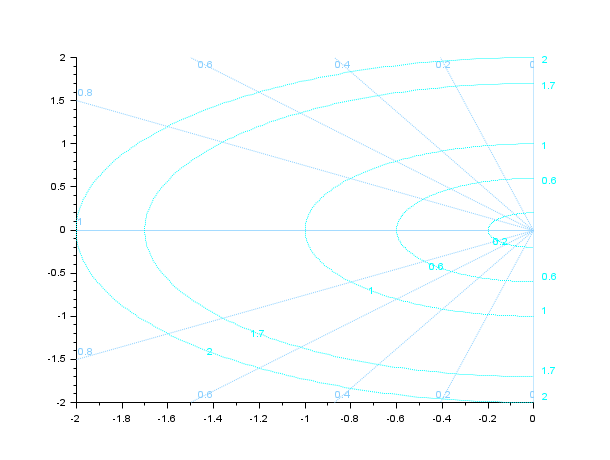
- sgrid
s-plane grid lines
Example:
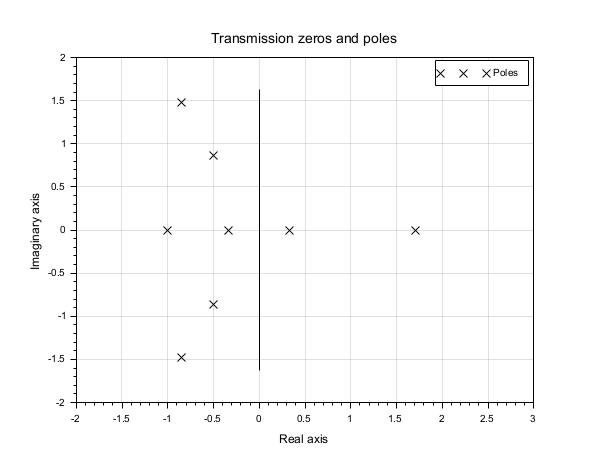
- plzr
pole-zero plot
Example:
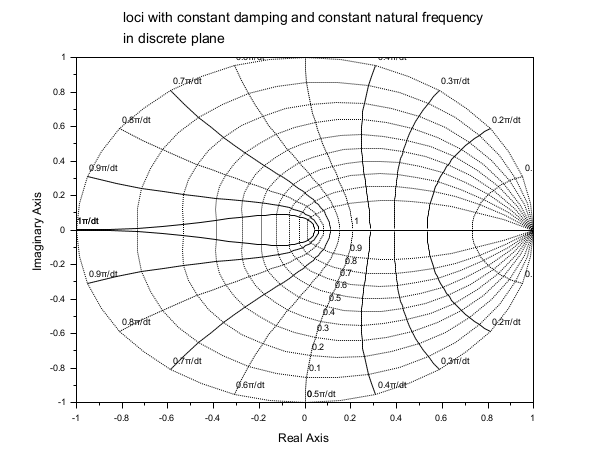
- zgrid
zgrid plot
Example:
| Report an issue | ||
| << GlobalProperty | Graphics | Compound properties >> |