subplot
grids the current figure or frame, and sets the current axes to a chosen cell
Syntax
subplot(m,n,p)
subplot(mnp)
ax = subplot(...)
Arguments
- m, n, p
- integers > 0. (m,n) = numbers of rows and columns of the virtual grid. p = index of the targeted cell.
- mnp
- an integer with decimal notation
mnp - ax
- handle of the created Axes entity
Description
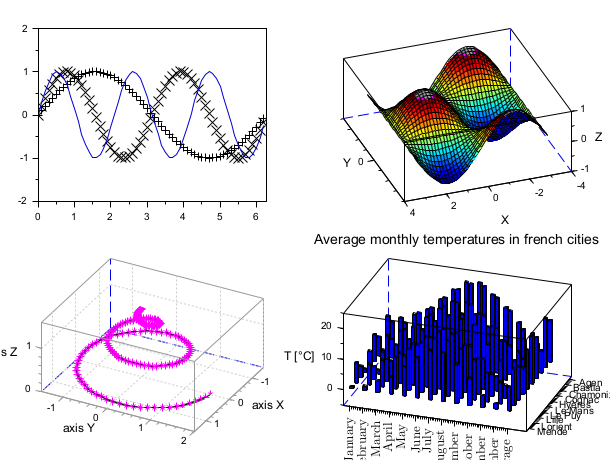
subplot(m,n,p) or subplot(mnp) virtually grids the current graphic window or uicontrol frame into a m-by-n matrix of rectangular sub-areas (cells), and selects the pth cell for receiving the forthcoming drawings.
Into the grid, cells are indexed along each row, starting from the top row.
Hence, the last cell of the first row is the p = nth
one. The cell on the row #i and the column #j has the index p=(i-1)*n+j.
When the selected cell matches exactly an existing axes, subplot(…)
just sets it as the current axes, and returns.
Otherwise, subplot(…) creates an empty axes covering the selected cell,
ready to receive forthcoming plotting contents.
Examples

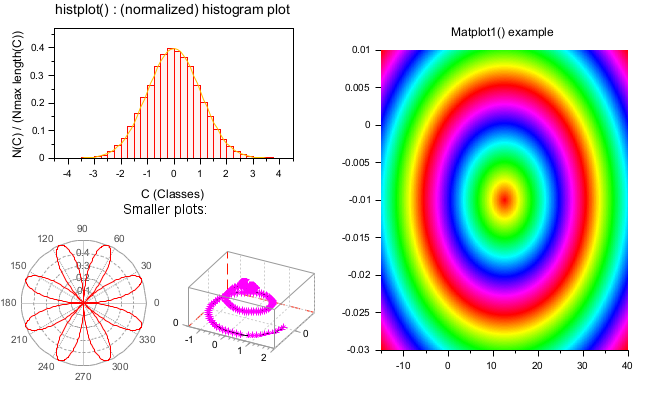
A more complex layout, but still gridable:
clf
subplot(1,2,2)
Matplot1()
xtitle("Matplot1() example","","")

subplot(2,2,1)
histplot
delete(findobj("type","Legend"))

subplot(2,2,3)
title("Smaller plots:", "fontsize",3)

subplot(2,4,5)
polarplot()

subplot(2,4,6)
param3d()
xtitle("","","","")

Usage on uicontrol frames :
x = -4:0.05:4;

f = figure(...
    "default_axes","off", ...
    "toolbar","none", ...
    "name","subplot in frames", ...
    "backgroundColor",[1 1 1]*0.97);

// Frame #1
b = createBorder("titled", "Frame #1");
uicontrol(f, ...
    "style", "frame", ...
    "units","normalized", ...
    "border", b, ...
    "position", [0.03 0.83 0.94 0.15]);

// Frame #2
b(2) = "Frame #2";
fr2 = uicontrol(f, ...
    "style", "frame", ...
    "units","normalized", ...
    "border", b, ...
    "position", [0.03 0.03 0.60 0.8]);

a2 = newaxes(fr2);
subplot(1,2,1)
plot(x, tanh(x)), title("tanh")

subplot(2,2,2)
plot(x, sinh(x)), title("sinh")

// Frame #3
b(2) = "Frame #3";
fr3 = uicontrol(f, ...
    "style", "frame", ...
    "units","normalized", ...
    "border", b, ...
    "position", [0.65 0.03 0.32 0.8]);

a3 = newaxes(fr3);
subplot(2,1,1)
plot(2*x, sinc(2*x)), title("sinc")

subplot(2,1,2)
plot(2*x, sin(2*x)), title("sin")

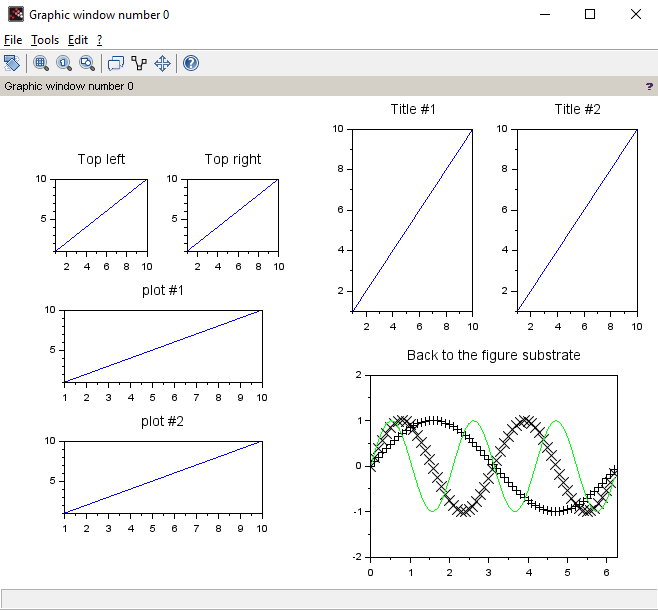
// Back to Frame #2
sca(a2);
subplot(2,2,4)
plot(x, cosh(x)), title("cosh")

See also
- xsetech — set the sub-window of a graphics window for plotting
- newaxes — Creates a new Axes entity
- axes_properties — description of the axes entity properties
History
| Version | Description |
| 2024.0 | subplot(…) can be used on uicontrol frames. |
| 2025.0 | subplot(…) now returns created/selected axes handle. |
| Report an issue | ||
| << sda | axes_operations | unzoom >> |