bar3d
3D bars plot
Syntax
bar3d()     // Example
bar3d(mtx,[theta,alpha,leg,flag,ebox])
bar3d(mtx,<opt_args>)
bar3d(list(mtx,x,y),[theta,alpha,leg,flag,ebox])
bar3d(list(mtx,x,y),<opt_args>)
hdl = bar3d(...)
Arguments
- mtx
matrix of size (m,n) defining the histogram
mtx(i,j)=F(x(i),y(j)), wherexandyare taken as0:mand0:n.- list(mtx,x,y)
where mtx is a matrix of size (m,n)defining the histogram
mtx(i,j)=F(x(i),y(j)), withxandyvectors of size (1,m+1) and (1,n+1).- <opt_args>
This represents a sequence of statements
key1=value1,
                            key2=value2
,... wherekey1,key2,...can be one of the following: theta, alpha,leg,flag,ebox. See plot3d.- theta,alpha,leg,flag,ebox
see plot3d.
- hdl
This optional output contains a handle to a
Fac3d. Usehdlto modify its properties. For a list of properties, see fec_properties.
Description
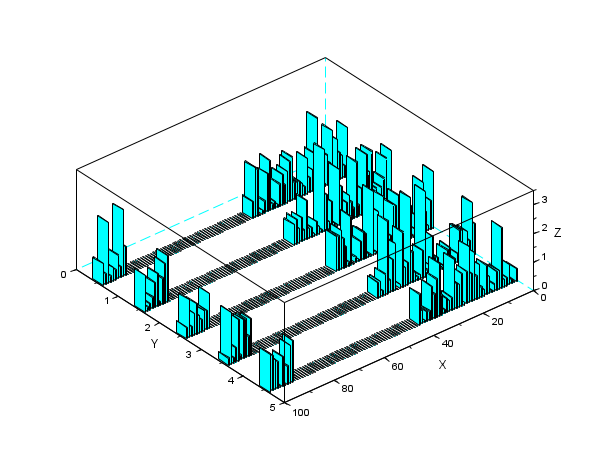
bar3d represents a 2d histogram as a 3D plot.
The values are associated to the intervals
[x(i), x(i+1)[ × [y(i), y(i+1)[.
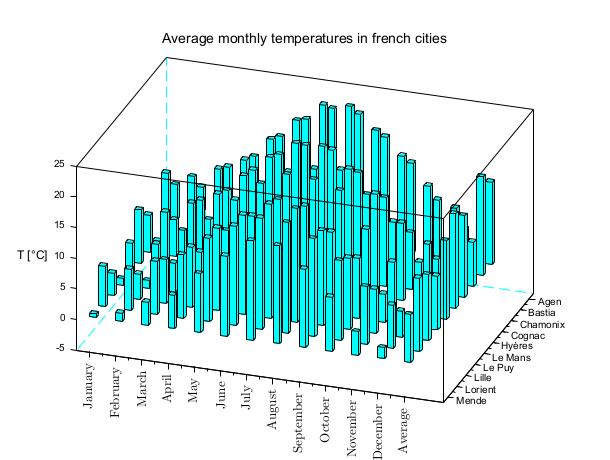
Enter the command bar3d() to see an example.
Examples
bar3d();
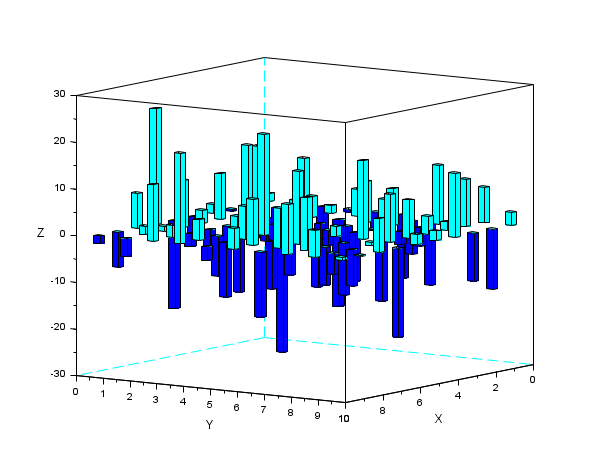
bar3d(grand(10, 10, "nor", 0, 10))
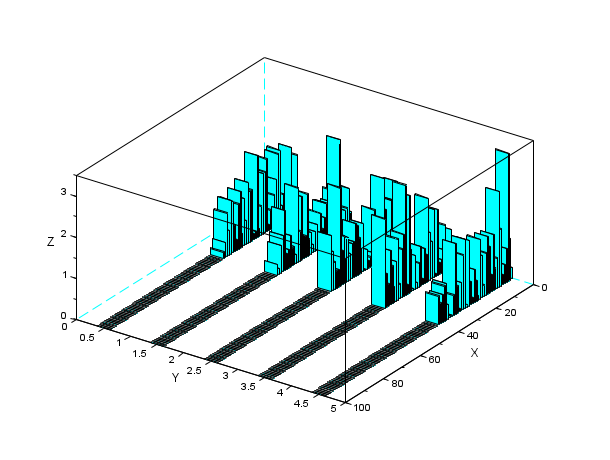
Z = zeros(100,5);
A = abs(rand(40,5));
Z(1:40,:) = A;
Index = find(Z==0);
Z(Index) = %nan;

clf
bar3d(Z)
isoview off
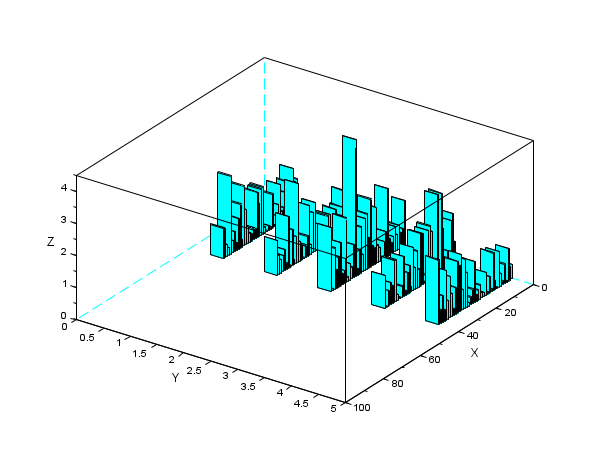
Z = zeros(100,5);
A = abs(rand(40,5));
Z(1:40,:) = A;
A = abs(rand(10,5));
Z(91:100,:) = A;

clf
bar3d(Z)
isoview off
History
| Version | Description |
| 6.1.0 | hist3d() renamed in bar3d(). |
| 2025.0.0 | Function returns the created handle(s). |
| Report an issue | ||
| << 3d_plot | 3d_plot | comet3d >> |