Scilab Website | Contribute with GitLab | Mailing list archives | ATOMS toolboxes
Scilab Online Help
2024.0.0 - English


plot2d2

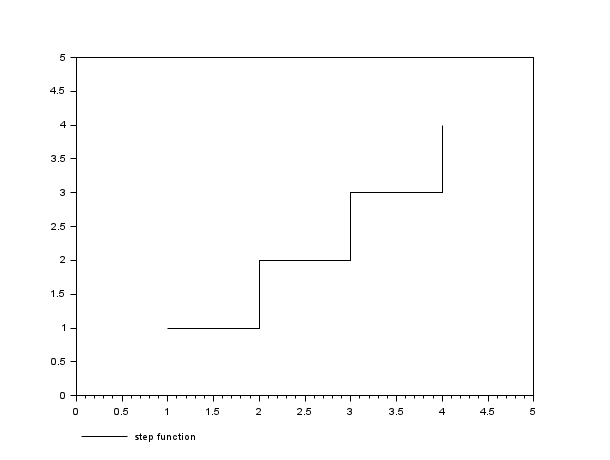
2D plot (step function)

Syntax

plot2d2([x],y)
plot2d2([x],y,<opt_args>)
plot2d2([logflag],x,y,[style,strf,leg,rect,nax])

Arguments

args

see plot2d for a description of parameters.

Description

plot2d2 is the same as plot2d but the functions given by (x,y) are supposed to be piecewise constant.

By default, successive plots are superposed. To clear the previous plot, use clf().

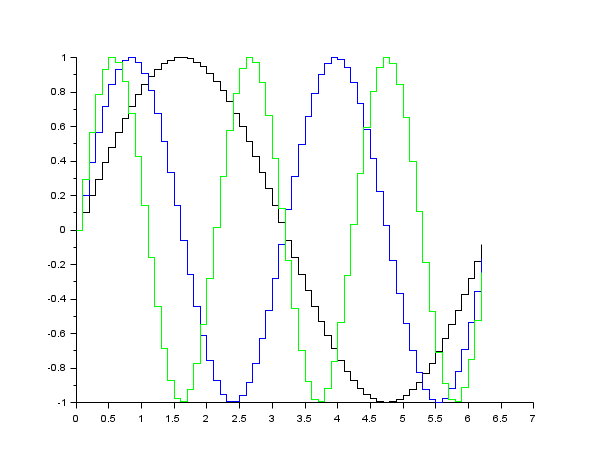
Enter the command plot2d2() to see a demo.

Note that all the modes proposed by plot2dxx (xx = 1 to 4) can be enabled using plot2d and setting the polyline_style option to the corresponding number.

Examples

// plots a step function of value i on the segment [i,i+1]
// the last segment is not drawn
plot2d2([1:4],[1:4],1,"111","step function",[0,0,5,5])
// compare the following with plot2d
x=[0:0.1:2*%pi]';
clf()
plot2d2(x,[sin(x) sin(2*x) sin(3*x)])
x=[0:0.1:2*%pi]';
clf();
plot2d(x,[sin(x) sin(2*x) sin(3*x)])
e=gce();
e.children(1).polyline_style=2;
e.children(2).polyline_style=2;
e.children(3).polyline_style=2;

See also

  • plot2d — 2D plot
  • plot2d3 — 2D plot (vertical bars)
  • plot2d4 — 2D plot (arrows style)
  • subplot — grids the current figure or frame, and sets the current axes to a chosen cell
  • clf — Clears and resets a figure or a frame uicontrol
  • polyline_properties — description of the Polyline entity properties
Report an issue
<< plot2d 2d_plot plot2d3 >>

Copyright (c) 2022-2023 (Dassault Systèmes)
Copyright (c) 2017-2022 (ESI Group)
Copyright (c) 2011-2017 (Scilab Enterprises)
Copyright (c) 1989-2012 (INRIA)
Copyright (c) 1989-2007 (ENPC)
with contributors
Last updated:
Tue Oct 24 14:30:04 CEST 2023