xstring
draw strings
Syntax
xstring(x, y, str)
xstring(x, y, str, angle)
xstring(x, y, str, angle, box)
h = xstring(...)
Arguments
- x,y
real vectors or scalars, coordinates of the lower-left point of the strings.
- str
matrix of strings.
Starting from Scilab 5.2, it is possible to write LaTeX or MathML expression.
- angle
real vector or scalar, clockwise angle in degree; default is 0.
- box
integer vector or scalar, default is 0.
- h
This optional output contains a handle to a Compound object whose children are the created Text entities. Use
hto modify properties of a specific or all Text entities after they are created. For a list of properties, see text_properties.
Description
If x is a real scalar, it's regarded as a vector with the size of y whose elements are set to x.
If y is a real scalar, it's regarded as a vector with the size of x whose elements are set to y.
xstring draws n strings at location (x[i], y[i]) in the current graphic scale.
If str contain n elements, these n elements are the n drawn strings.
Otherwise, each row of the matrix stands for a line of text and row elements stand for words separated by a white space.
If angle is a real scalar, it's regarded as a vector of size n whose elements are set to angle.
angle(i)gives the slope in degree used for drawing the strings at location (x[i], y[i]).
If box is an integer scalar, it's regarded as a vector of size n whose elements are set to box.
If box(i) is 1 and angle(i) is 0, a box is drawn around the strings at location (x[i], y[i]).
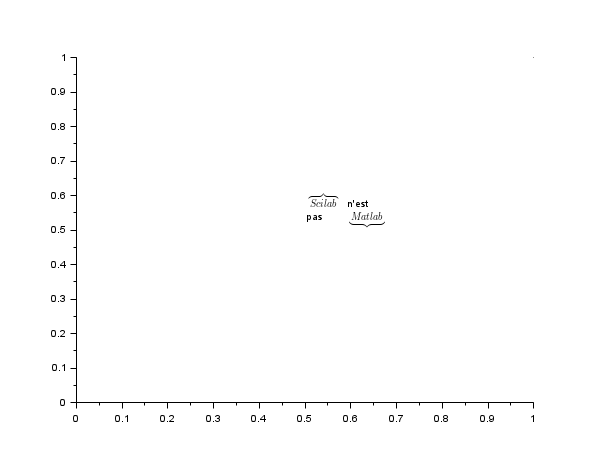
Examples
plot2d([0;1],[0;1],0)
xstring(0.5,0.5,["$\overbrace{Scilab}$" "n''est ";"pas" "$\underbrace{Matlab}$"])
// LaTeX rendering (>= Scilab 5.2)

//Other example
alphabet=["a" "b" "c" "d" "e" "f" "g" ..
          "h" "i" "j" "k" "l" "m" "n" ..
          "o" "p" "q" "r" "s" "t" "u" ..
          "v" "w" "x" "y" "z"];
clf()
plot2d([0;1],[0;2],0)
xstring(0.1,1.8,alphabet)     // alphabet
xstring(0.1,1.6,alphabet,0,1) // alphabet in a box
xstring(0.1,1.4,alphabet,20)  // angle
set(gca(), "font_style", 1, "font_size", 1);  // use symbol fonts
xstring(0.1,0.1,alphabet)
h = xstring(0.1,0.3,alphabet)
h.font_size = 3;          // change the font size
h = xstring(0.1,0.6,"a")    //big alpha
h.font_size = 24;
See also
- text_properties — description of the Text entity properties
- Math mode in strings — Display mathematical equations in Scilab graphics through the LaTeX or MathML languages.
- xnumb — draw numbers
- xtitle — add titles on a graphics window
- titlepage — add a title in the middle of a graphics window
History
| Version | Description |
| 2025.0.0 | Function returns the created handle(s). |
| Report an issue | ||
| << xnumb | text | xstringb >> |