Please note that the recommended version of Scilab is 2026.0.1. This page might be outdated.
See the recommended documentation of this function
airy
Airy functions of the first and second kind, and their derivatives
Syntax
a = airy(z)
a = airy(fun, z)
a = airy(fun, z, scaled)
Arguments
- z
- array of decimal or complex numbers of any size, from scalr to hypermatrix.
- fun
- Selected Airy function to evaluate. It can be either a string among
"Ai" "dAi" "Bi" "dBi", or an equivalent integer in [0, 3] (for compatibility
with Octave and Julia)
fun Description 0 "Ai" Airy function of the first kind (default) 1 "dAi" Derivative Ai' of Ai 2 "Bi" Airy function of the second kind 3 "dBi" Derivative Bi' of Bi - scaled
- Single boolean or integer 0|1. Default %F. When
scaledis %T or set to 1, the raw result is scaled by the following factors before being returned:Ai, dAi : 
Bi, dBi : 
Description
For a real x variable, the Airy functions of the first and second kind -- respectively Ai(x) and Bi(x) -- are independent real solutions y(x) of the Airy differential equation y'' = x.y. They are defined as the convergent integrals

![Bi(x) = 1/π \int_0^∞ [sin(t^3/3 + xt) + exp(-t^3/3 + xt)] dt](/docs/6.1.0/ja_JP/_LaTeX_airy.xml_4.png)
These definitions can be extended to the complex plane, for any z complex variable, as

Let us note the properties

In Scilab, Ai, Bi, and their first derivative are computed through Bessel and gamma functions.
Examples
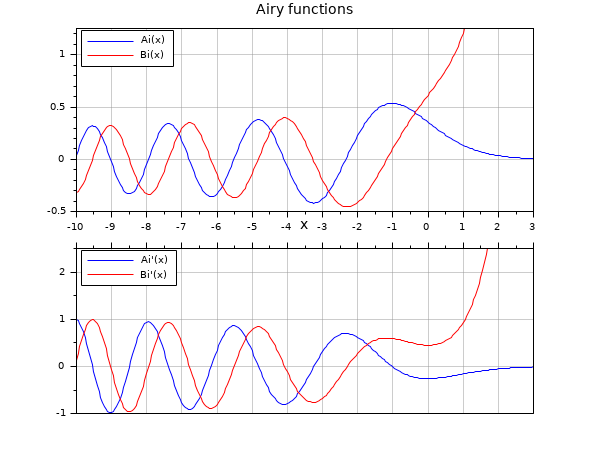
With real numbers
x = -10:0.05:3;
clf
drawlater

subplot(2,1,1)  // Ai, Bi
plot(x, airy(x), "b", x, airy(2,x), "r")
gca().margins(4) = 0.08;
gca().data_bounds(3:4) = [-0.5 1.25];
gca().tight_limits = "on";
xgrid(color("grey60"),1,7)
legend(["Ai(x)" "Bi(x)"],"in_upper_left")
title("Airy functions", "fontsize", 3)

subplot(2,1,2)  // Derivatives
plot(x, airy(1, x), "b", x, airy(3,x), "r")
legend(["Ai''(x)" "Bi''(x)"],"in_upper_left")
xlabel("x", "fontsize", 3)
gca().margins(3) = 0.08;
gca().x_location = "top";
gca().x_ticks.labels = emptystr(gca().x_ticks.labels);
gca().data_bounds(3:4) = [-1 2.5];
gca().tight_limits = "on";
xgrid(color("grey60"),1,7)

drawnow

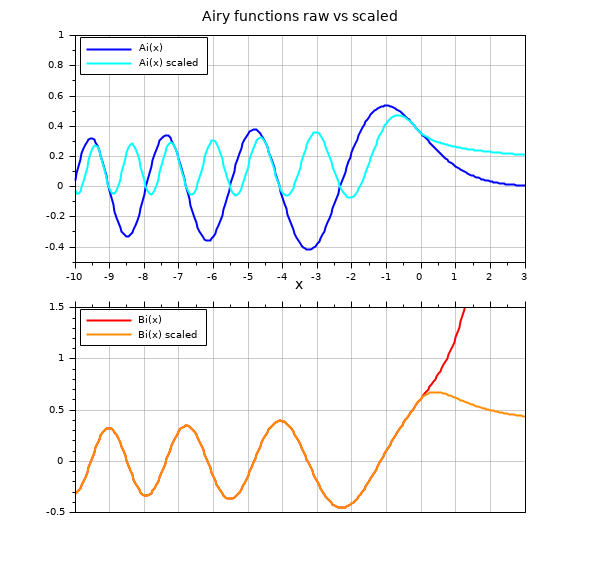
With scaling
x = -10:0.05:3;
clf
drawlater

subplot(2,1,1)  // Ai, Ai scaled
plot(x, airy("Ai",x), x, airy("Ai",x, %t), "color", ["blue" "cyan"])
gca().margins(4) = 0.08;
gca().data_bounds(3:4) = [-0.5 1];
gca().tight_limits = "on";
xgrid(color("grey60"),1,7)
legend(["Ai(x)" "Ai(x) scaled"],"in_upper_left")
title("Airy functions raw vs scaled", "fontsize", 3)

subplot(2,1,2)  // Bi, Bi scaled
plot(x, airy("Bi", x), x, airy("Bi",x, %t), "color", ["red" "darkorange"])
legend(["Bi(x)" "Bi(x) scaled"],"in_upper_left")
xlabel("x", "fontsize", 3)
gca().margins(3) = 0.08;
gca().x_location = "top";
gca().x_ticks.labels = emptystr(gca().x_ticks.labels);
gca().data_bounds(3:4) = [-0.5 1.5];
gca().tight_limits = "on";
xgrid(color("grey60"),1,7)

gcf().children.children.children.thickness = 2;
drawnow

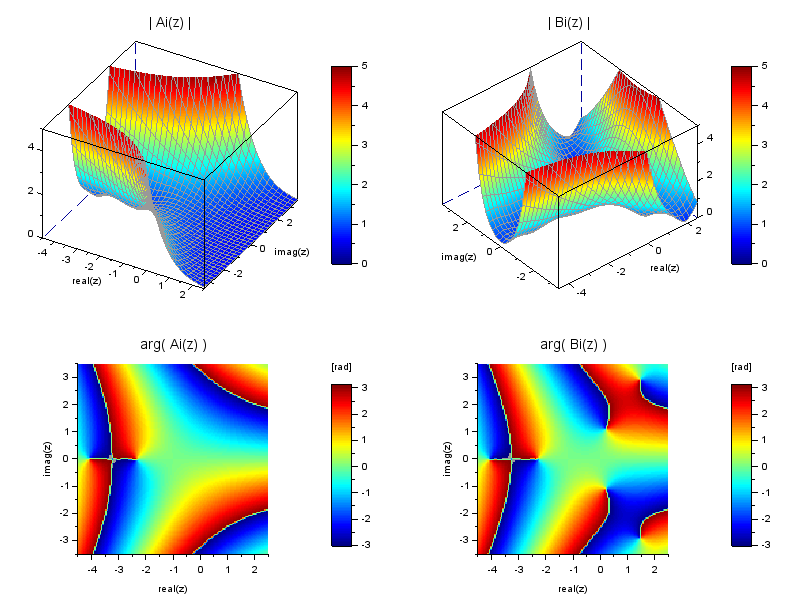
With complex numbers
// Initializations
x = -4.5:0.2:2.5;
y = -3.5:0.2:3.5;
[X, Y] = meshgrid(x, y);
xph = -4.5:0.05:2.5;
yph = -3.5:0.05:3.5;
[Xph, Yph] = meshgrid(xph, yph);
clf
fig = gcf();
drawlater
[nc, cmin] = (100, 15);
fig.color_map = [0.6 0.6 0.6; jetcolormap(nc-1)];
meshColor = 1; // grey60 will be used for the mesh color
fig.axes_size = [800 600];
fr = 0.55;

// |Ai|
xsetech([0 0 0.5 fr])
Z = X + %i*Y;
Z = airy(Z);
V = abs(Z);
[smin, smax] = (0, 5);
surf(x, y, V)
S = gce();
set(S, "color_flag",3, "color_mode",1, ..
       "cdata_mapping","direct", "foreground",meshColor);
c = S.data.color;
c = cmin + (nc-cmin)*(c-smin)/(smax-smin);
S.data.color = c;
gca().zoom_box = [min(x) min(y) max(x) max(y) smin smax];
gca().rotation_angles = [47 -60];
xtitle("", "real(z)","imag(z)", "")
title("| Ai(z) |", "fontsize",3)
colorbar(smin, smax, [2, nc])

// arg(Ai)
xsetech([0 fr 0.5 (1-fr)])
Z = airy(Xph + %i*Yph);
V = atan(imag(Z),real(Z));
grayplot(xph, yph, V.')
xtitle("","real(z)", "imag(z)")
title("arg( Ai(z) )", "fontsize", 3)
gca().tight_limits = "on";
isoview
colorbar(,,[2 nc])
title(fig.children(1), "[rad]")

// |Bi|
xsetech([0.50 0 0.5 fr])
Z = X + %i*Y;
Z = airy(2, Z);
V = abs(Z);
[smin, smax] = (0, 5);
surf(x, y, V)
S = gce();
set(S, "color_flag",3, "color_mode",1, ..
       "cdata_mapping","direct", "foreground",meshColor);
c = S.data.color;
c = cmin + (nc-cmin)*(c-smin)/(smax-smin);
S.data.color = c;
gca().zoom_box = [min(x) min(y) max(x) max(y) smin smax];
gca().rotation_angles = [40 -130];
xtitle("", "real(z)","imag(z)", "")
title("| Bi(z) |", "fontsize",3)
colorbar(smin, smax, [2, nc])

// arg(Bi)
xsetech([0.5 fr 0.5 (1-fr)])
Z = airy(3, Xph + %i*Yph);
V = atan(imag(Z),real(Z));
grayplot(xph, yph, V.')
xtitle("","real(z)", "imag(z)")
title("arg( Bi(z) )", "fontsize", 3)
gca().tight_limits = "on";
isoview
colorbar(,,[2 nc])
title(fig.children(1), "[rad]")

drawnow

History
| Version | Description |
| 6.1.0 | airy() introduced. |
| Report an issue | ||
| << %sn | Special Functions | amell >> |