Please note that the recommended version of Scilab is 2026.0.1. This page might be outdated.
See the recommended documentation of this function
surf
3次元曲面プロット
呼び出し手順
surf()  // sample
surf(Z)
surf(X, Y, Z)
surf(X, Y, fun)
surf(X, Y, list(fun, params))
surf(.., colors)
surf(.., <GlobalProperty>)
surf(.., colors, <GlobalProperty>)
surf(axes_handle,...)
引数
- X,Y
two vectors of real numbers, of lengths
nxandny; or two real matrices of sizesnyxnx: They define the data grid (horizontal coordinates of the grid nodes). All grid cells are quadrangular but not necessarily rectangular.By default,
X = 1:size(Z,2)andY = 1:size(Z,1)are used.- Z
曲面の高さを定義する実数行列.省略することはできません. Zデータは
nyxnx行列です.- fun
handle of a function, as in
surf(x,y, myFun)where the expected syntax ofmyFunisZ=myFun(X,Y).If the 2D function
funto plot needs some parameters as input arguments, the function and its parameters can be specified through a list, as insurf(x,y, list(delip, -0.4))orsurf(x,y, list(myfun, a,b))withZ = myFun(X,Y, a,b)If
Xor/andYare grid-generating vectors whilefun(…)expects only input matrices,surf(…)automatically generates matrices fromXor/andYand properly callsfun(…).- colors
オプションの実数行列で,グリッドの 各点
(X(j),Y(i))に関する色の値を定義します (下記説明参照).- <GlobalProperty>
このオプションの引数は, グローバルオブジェクトのプロパティを定義する 一連の命令
{PropertyName,PropertyValue}を表し, このプロットで作成された全ての曲線に適用されます (利用可能なプロパティの完全なリストについては, GlobalPropertyを参照.)- axes_handle
このオプションの引数は, カレントの軸 (gca参照)ではなく,
axes_handleにより指定された軸の内部へのプロットを 強制します.
説明
surf は,
X Y座標で定義される矩形グリッドを用いて
パラメータ表現の曲面をカラーでプロットします.
surfはMatlabの構文をより良く扱うために作成されました.
グラフィックの互換性を改善するために, Matlabユーザは
( plot3dではなく)
surf を使用する必要があります.
データエントリの仕様 :
このパラグラフでは,より明確化するために,
GlobalPropertyオプション引数について言及しません.
これは,それらがentry dataと干渉しないからです.
("Xdata", "Ydata" および
"Zdata" プロパティを除く, GlobalProperty参照).
これらのオプションの引数も全て使用可能と仮定されます.
Xまたは Y 次のようになります :
a) ベクトル :
Xがベクトルの場合, length(X)=nxです.Yがベクトルの場合, length(Y)=nyです.b) 行列 : この場合, size(
X) (または size(Y)) は size(Z)に等しい必要があります.
Colorエントリの仕様 :
前記のように, 曲面は矩形グリッドのサポートにより作成されます.
以下のような2つの独立変数 i および
jを考えてみましょう:
a) 1 <= i <= ny  and 1 <= j <= nx
b) i-1,j-1 ---- i-1,j ---- i-1,j+1 ---… |
      |            |          |         | i direction
     i,j-1 -----  i,j -----  i,j+1 ---… |
      |            |          |         |
      :            :          :
                             ............> j direction
この仮想的な矩形グリッドは,
XY平面に支持された
実際の曲面を構築する際に使用されます.
実際には,
X,Y および Z
データは
(X または Y がベクトルの場合でも, 下記参照)
同じ大きさを有し,
曲面を指定する3つの関数x(i,j), y(i,j) および
z(i,j)として扱うことができます.
X またはYがベクトルの場合,
内部的には行列Zの次元と一致する正しい行列を作成する
ために使用されます(グリッドは強制的に矩形領域となります).
3つの関数x(i,j), y(i,j)
および z(i,j)を考えると,
連続する2つのi and jの間で
定義される曲面の部分は,パッチと呼ばれます.
デフォルトで, colors行列がsurfのコール時に付加されない場合,
colorsパラメータはZデータにリンクされます.
colors行列が指定された場合,
2種類の異なる手段でパッチに適用されます:
頂点または各パッチの中心.
これにより,
Z が [nyxnx]行列の場合,
C colors行列の次元は[nyxnx]
(頂点毎に1つの色)または
[ny-1xnx-1] (パッチ毎に1色)とします.
Colorの表現はいくつかのGlobalProperyの設定によっても変化します:
FaceColorプロパティは影モードを設定します :
この値は'interp' または 'flat' (デフォルトモード)となります.
'interp'が選択された場合,
パッチに双一次色補間が適用されます.
size(C) が size(Z)-1 に等しい場合
(すなわち,各パッチ毎に1色のみが指定される場合),
パッチを定義する頂点の色はそのパッチに指定された色に設定されます.
'flat' (デフォルトモード) が有効の場合,
カラー小平面表現(パッチ毎に1色)を使用します.
size(C)がsize(Z) (すなわち,
各頂点毎に1つの色のみを指定した場合)に等しい場合, C
の最後の行と列は無視されます.
GlobalProperty 引数は曲面をカスタマイズする際に使用されます.
以下にその動作について簡単に説明します:
- GlobalProperty
このオプションは曲面の描画方法を指定するために使用できます. これは,
PropertyNameおよびその値PropertyValue(PropertyNameの型に 依存して文字列,整数または...となります) を定義する文字列から構成される一連の命令となります. 複数のプロパティを設定することもできます: 面および縁の色, 色データ, 色データのマッピング, クリッピングおよび 曲面の縁の厚さ... (GlobalProperty参照 )これらのプロパティは全てsurfaceエンティティプロパティにより(再)設定できます (surface_properties参照).
 | 注意: デフォルトで, 連続する曲面のプロットは重ね描きされます.
前のプロットを消去するには, clf()を使用してください.
Tauto_clearモードをデフォルトのモードとして有効にするには,
デフォルトの軸を以下のように編集してください: gda().auto_clear = 'on'
コマンド surf() によりデモを参照できます. |
例
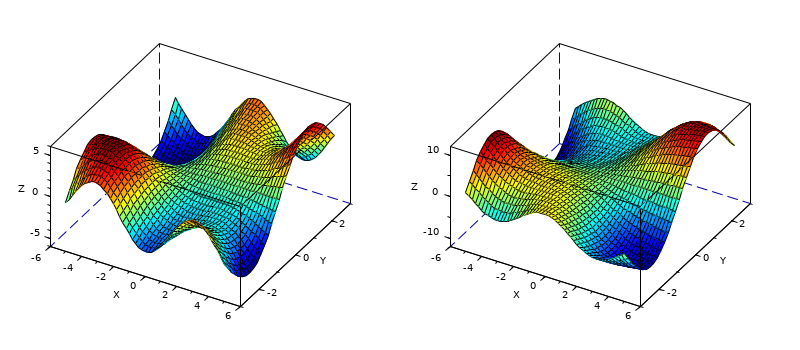
With a function:
function z=mySurf(x, y, a, b)
    if ~isdef("a","l"), a = 1, end
    if ~isdef("b","l"), b = 1, end
    z = a*x.*sin(y) + b*y.*cos(x);
endfunction
clf
subplot(121), surf(-5:0.2:5, -3:0.2:3, mySurf)              // without parameters
subplot(122), surf(-5:0.2:5, -3:0.2:3, list(mySurf, 2,-1))  // with parameters

gcf().color_map = jetcolormap(100);
set(gcf(), "axes_size", [800 350], "rotation_style","multiple");
gca().rotation_angles = [40 -60];
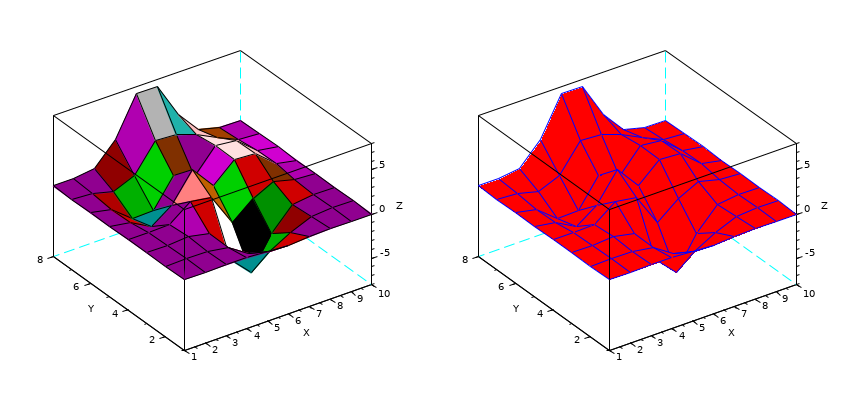
surf(Z):
// Zの初期化
Z= [0.0001    0.0013    0.0053   -0.0299   -0.1809   -0.2465   -0.1100   -0.0168   -0.0008   -0.0000
    0.0005    0.0089    0.0259   -0.3673   -1.8670   -2.4736   -1.0866   -0.1602   -0.0067    0.0000
    0.0004    0.0214    0.1739   -0.3147   -4.0919   -6.4101   -2.7589   -0.2779    0.0131    0.0020
   -0.0088   -0.0871    0.0364    1.8559    1.4995   -2.2171   -0.2729    0.8368    0.2016    0.0130
   -0.0308   -0.4313   -1.7334   -0.1148    3.0731    0.4444    2.6145    2.4410    0.4877    0.0301
   -0.0336   -0.4990   -2.3552   -2.1722    0.8856   -0.0531    2.6416    2.4064    0.4771    0.0294
   -0.0137   -0.1967   -0.8083    0.2289    3.3983    3.1955    2.4338    1.2129    0.2108    0.0125
   -0.0014   -0.0017    0.3189    2.7414    7.1622    7.1361    3.1242    0.6633    0.0674    0.0030];

// 簡単な曲面
clf
subplot(121)
surf(Z);  // X および Y はZの次元により定義されます

// 面の色が赤,縁が青の同じ曲面
subplot(122)
surf(Z,'facecol','red','edgecol','blu');

gcf().axes_size = [850 400];
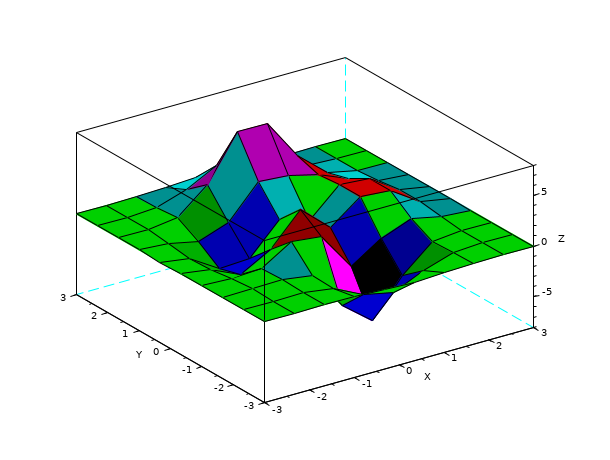
surf(X, Y, Z):
// X および Y の初期化
// NB: here, X has the same lines and Y the same columns
X=[-3.0000   -2.3333   -1.6667   -1.0000   -0.3333    0.3333    1.0000    1.6667    2.3333    3.0000
   -3.0000   -2.3333   -1.6667   -1.0000   -0.3333    0.3333    1.0000    1.6667    2.3333    3.0000
   -3.0000   -2.3333   -1.6667   -1.0000   -0.3333    0.3333    1.0000    1.6667    2.3333    3.0000
   -3.0000   -2.3333   -1.6667   -1.0000   -0.3333    0.3333    1.0000    1.6667    2.3333    3.0000
   -3.0000   -2.3333   -1.6667   -1.0000   -0.3333    0.3333    1.0000    1.6667    2.3333    3.0000
   -3.0000   -2.3333   -1.6667   -1.0000   -0.3333    0.3333    1.0000    1.6667    2.3333    3.0000
   -3.0000   -2.3333   -1.6667   -1.0000   -0.3333    0.3333    1.0000    1.6667    2.3333    3.0000
   -3.0000   -2.3333   -1.6667   -1.0000   -0.3333    0.3333    1.0000    1.6667    2.3333    3.0000
   -3.0000   -2.3333   -1.6667   -1.0000   -0.3333    0.3333    1.0000    1.6667    2.3333    3.0000
   -3.0000   -2.3333   -1.6667   -1.0000   -0.3333    0.3333    1.0000    1.6667    2.3333    3.0000];

Y=[-3.0000   -3.0000   -3.0000   -3.0000   -3.0000   -3.0000   -3.0000   -3.0000   -3.0000   -3.0000
   -2.3333   -2.3333   -2.3333   -2.3333   -2.3333   -2.3333   -2.3333   -2.3333   -2.3333   -2.3333
   -1.6667   -1.6667   -1.6667   -1.6667   -1.6667   -1.6667   -1.6667   -1.6667   -1.6667   -1.6667
   -1.0000   -1.0000   -1.0000   -1.0000   -1.0000   -1.0000   -1.0000   -1.0000   -1.0000   -1.0000
   -0.3333   -0.3333   -0.3333   -0.3333   -0.3333   -0.3333   -0.3333   -0.3333   -0.3333   -0.3333
    0.3333    0.3333    0.3333    0.3333    0.3333    0.3333    0.3333    0.3333    0.3333    0.3333
    1.0000    1.0000    1.0000    1.0000    1.0000    1.0000    1.0000    1.0000    1.0000    1.0000
    1.6667    1.6667    1.6667    1.6667    1.6667    1.6667    1.6667    1.6667    1.6667    1.6667
    2.3333    2.3333    2.3333    2.3333    2.3333    2.3333    2.3333    2.3333    2.3333    2.3333
    3.0000    3.0000    3.0000    3.0000    3.0000    3.0000    3.0000    3.0000    3.0000    3.0000];

Z= [0.0001    0.0013    0.0053   -0.0299   -0.1809   -0.2465   -0.1100   -0.0168   -0.0008   -0.0000
    0.0005    0.0089    0.0259   -0.3673   -1.8670   -2.4736   -1.0866   -0.1602   -0.0067    0.0000
    0.0004    0.0214    0.1739   -0.3147   -4.0919   -6.4101   -2.7589   -0.2779    0.0131    0.0020
   -0.0088   -0.0871    0.0364    1.8559    1.4995   -2.2171   -0.2729    0.8368    0.2016    0.0130
   -0.0308   -0.4313   -1.7334   -0.1148    3.0731    0.4444    2.6145    2.4410    0.4877    0.0301
   -0.0336   -0.4990   -2.3552   -2.1722    0.8856   -0.0531    2.6416    2.4064    0.4771    0.0294
   -0.0137   -0.1967   -0.8083    0.2289    3.3983    3.1955    2.4338    1.2129    0.2108    0.0125
   -0.0014   -0.0017    0.3189    2.7414    7.1622    7.1361    3.1242    0.6633    0.0674    0.0030
    0.0002    0.0104    0.1733    1.0852    2.6741    2.6725    1.1119    0.1973    0.0152    0.0005
    0.0000    0.0012    0.0183    0.1099    0.2684    0.2683    0.1107    0.0190    0.0014    0.0000];

scf(3)
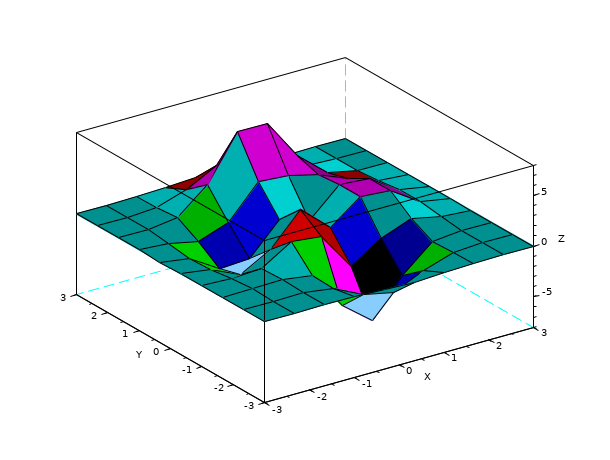
surf(X,Y,Z)
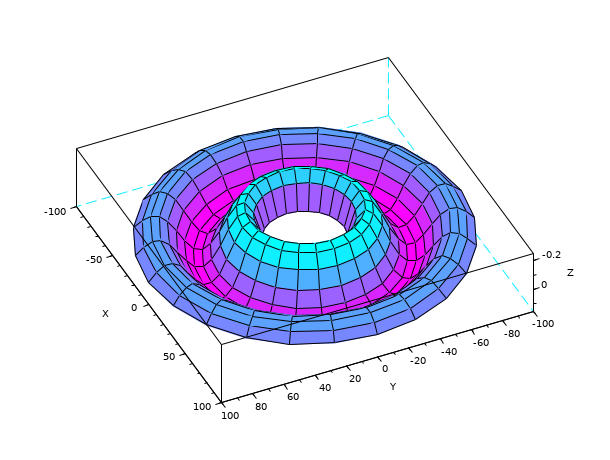
surf(X,Y,Z) on a cylindrical grid.. Facets are still quadrangular:
theta = 0:15:360;
r = 25:5:100;
[R,T] = ndgrid(r,theta);
X = R.*cosd(T);
Y = R.* sind(T);
Z = sinc(R/8);

clf
surf(X, Y, Z)

gcf().color_map = coolcolormap(50);
gca().rotation_angles=[195 -155];
// 例3
// X および Y はベクトル => サンプル1と同じ動作
// ベクトルを指定すると, グリッドは必然的に矩形となる
scf(5)// 図5を新規作成
X = [-3.0000  -2.3333  -1.6667  -1.0000  -0.3333   0.3333   1.0000   1.6667   2.3333   3.0000];
Y = X;
Z =[0.0001    0.0013    0.0053   -0.0299   -0.1809   -0.2465   -0.1100   -0.0168   -0.0008   -0.0000
    0.0005    0.0089    0.0259   -0.3673   -1.8670   -2.4736   -1.0866   -0.1602   -0.0067    0.0000
    0.0004    0.0214    0.1739   -0.3147   -4.0919   -6.4101   -2.7589   -0.2779    0.0131    0.0020
   -0.0088   -0.0871    0.0364    1.8559    1.4995   -2.2171   -0.2729    0.8368    0.2016    0.0130
   -0.0308   -0.4313   -1.7334   -0.1148    3.0731    0.4444    2.6145    2.4410    0.4877    0.0301
   -0.0336   -0.4990   -2.3552   -2.1722    0.8856   -0.0531    2.6416    2.4064    0.4771    0.0294
   -0.0137   -0.1967   -0.8083    0.2289    3.3983    3.1955    2.4338    1.2129    0.2108    0.0125
   -0.0014   -0.0017    0.3189    2.7414    7.1622    7.1361    3.1242    0.6633    0.0674    0.0030
    0.0002    0.0104    0.1733    1.0852    2.6741    2.6725    1.1119    0.1973    0.0152    0.0005
    0.0000    0.0012    0.0183    0.1099    0.2684    0.2683    0.1107    0.0190    0.0014    0.0000];
surf(X,Y,Z)
//LineSpec および GlobalProperty の例:
Z= [   0.0001    0.0013    0.0053   -0.0299   -0.1809   -0.2465   -0.1100   -0.0168   -0.0008   -0.0000
    0.0005    0.0089    0.0259   -0.3673   -1.8670   -2.4736   -1.0866   -0.1602   -0.0067    0.0000
    0.0004    0.0214    0.1739   -0.3147   -4.0919   -6.4101   -2.7589   -0.2779    0.0131    0.0020
   -0.0088   -0.0871    0.0364    1.8559    1.4995   -2.2171   -0.2729    0.8368    0.2016    0.0130
   -0.0308   -0.4313   -1.7334   -0.1148    3.0731    0.4444    2.6145    2.4410    0.4877    0.0301
   -0.0336   -0.4990   -2.3552   -2.1722    0.8856   -0.0531    2.6416    2.4064    0.4771    0.0294
   -0.0137   -0.1967   -0.8083    0.2289    3.3983    3.1955    2.4338    1.2129    0.2108    0.0125
   -0.0014   -0.0017    0.3189    2.7414    7.1622    7.1361    3.1242    0.6633    0.0674    0.0030
    0.0002    0.0104    0.1733    1.0852    2.6741    2.6725    1.1119    0.1973    0.0152    0.0005
    0.0000    0.0012    0.0183    0.1099    0.2684    0.2683    0.1107    0.0190    0.0014    0.0000];

xdel(winsid()) // 既存の図を全て削除
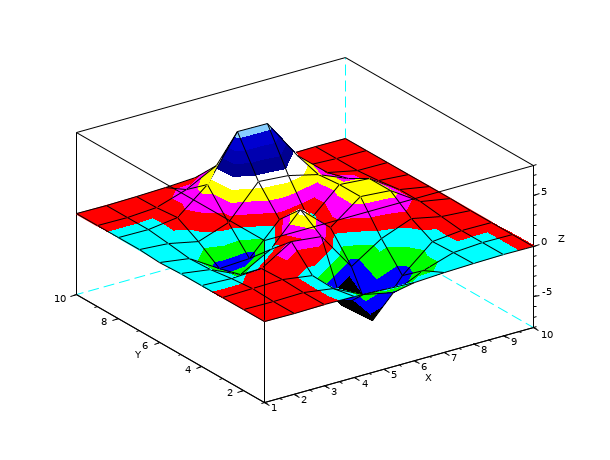
surf(Z,Z+5) // colors 配列を指定
e=gce();
e.cdata_mapping='direct' // デフォルトはカラーマップに関して 'scaled' r
e.color_flag=3; // 補間影モード. surf のデフォルトは 4 ('flat' モード)
X = [ -3.0000   -2.3333   -1.6667   -1.0000   -0.3333    0.3333    1.0000    1.6667    2.3333    3.0000
   -3.0000   -2.3333   -1.6667   -1.0000   -0.3333    0.3333    1.0000    1.6667    2.3333    3.0000
   -3.0000   -2.3333   -1.6667   -1.0000   -0.3333    0.3333    1.0000    1.6667    2.3333    3.0000
   -3.0000   -2.3333   -1.6667   -1.0000   -0.3333    0.3333    1.0000    1.6667    2.3333    3.0000
   -3.0000   -2.3333   -1.6667   -1.0000   -0.3333    0.3333    1.0000    1.6667    2.3333    3.0000
   -3.0000   -2.3333   -1.6667   -1.0000   -0.3333    0.3333    1.0000    1.6667    2.3333    3.0000
   -3.0000   -2.3333   -1.6667   -1.0000   -0.3333    0.3333    1.0000    1.6667    2.3333    3.0000
   -3.0000   -2.3333   -1.6667   -1.0000   -0.3333    0.3333    1.0000    1.6667    2.3333    3.0000
   -3.0000   -2.3333   -1.6667   -1.0000   -0.3333    0.3333    1.0000    1.6667    2.3333    3.0000
   -3.0000   -2.3333   -1.6667   -1.0000   -0.3333    0.3333    1.0000    1.6667    2.3333    3.0000];

Y= [   -3.0000   -3.0000   -3.0000   -3.0000   -3.0000   -3.0000   -3.0000   -3.0000   -3.0000   -3.0000
   -2.3333   -2.3333   -2.3333   -2.3333   -2.3333   -2.3333   -2.3333   -2.3333   -2.3333   -2.3333
   -1.6667   -1.6667   -1.6667   -1.6667   -1.6667   -1.6667   -1.6667   -1.6667   -1.6667   -1.6667
   -1.0000   -1.0000   -1.0000   -1.0000   -1.0000   -1.0000   -1.0000   -1.0000   -1.0000   -1.0000
   -0.3333   -0.3333   -0.3333   -0.3333   -0.3333   -0.3333   -0.3333   -0.3333   -0.3333   -0.3333
    0.3333    0.3333    0.3333    0.3333    0.3333    0.3333    0.3333    0.3333    0.3333    0.3333
    1.0000    1.0000    1.0000    1.0000    1.0000    1.0000    1.0000    1.0000    1.0000    1.0000
    1.6667    1.6667    1.6667    1.6667    1.6667    1.6667    1.6667    1.6667    1.6667    1.6667
    2.3333    2.3333    2.3333    2.3333    2.3333    2.3333    2.3333    2.3333    2.3333    2.3333
    3.0000    3.0000    3.0000    3.0000    3.0000    3.0000    3.0000    3.0000    3.0000    3.0000];

Z= [   0.0001    0.0013    0.0053   -0.0299   -0.1809   -0.2465   -0.1100   -0.0168   -0.0008   -0.0000
    0.0005    0.0089    0.0259   -0.3673   -1.8670   -2.4736   -1.0866   -0.1602   -0.0067    0.0000
    0.0004    0.0214    0.1739   -0.3147   -4.0919   -6.4101   -2.7589   -0.2779    0.0131    0.0020
   -0.0088   -0.0871    0.0364    1.8559    1.4995   -2.2171   -0.2729    0.8368    0.2016    0.0130
   -0.0308   -0.4313   -1.7334   -0.1148    3.0731    0.4444    2.6145    2.4410    0.4877    0.0301
   -0.0336   -0.4990   -2.3552   -2.1722    0.8856   -0.0531    2.6416    2.4064    0.4771    0.0294
   -0.0137   -0.1967   -0.8083    0.2289    3.3983    3.1955    2.4338    1.2129    0.2108    0.0125
   -0.0014   -0.0017    0.3189    2.7414    7.1622    7.1361    3.1242    0.6633    0.0674    0.0030
    0.0002    0.0104    0.1733    1.0852    2.6741    2.6725    1.1119    0.1973    0.0152    0.0005
    0.0000    0.0012    0.0183    0.1099    0.2684    0.2683    0.1107    0.0190    0.0014    0.0000];

scf(2)
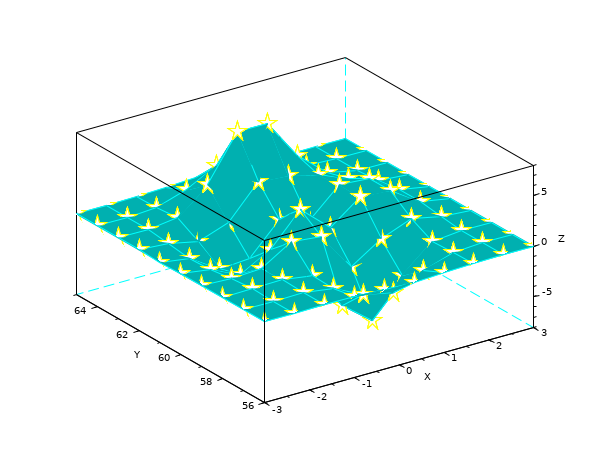
surf(X,Y,Z,'colorda',ones(10,10),'edgeco','cya','marker','penta','markersiz',20,'markeredg','yel','ydata',56:65)
Z= [   0.0001    0.0013    0.0053   -0.0299   -0.1809   -0.2465   -0.1100   -0.0168   -0.0008   -0.0000
    0.0005    0.0089    0.0259   -0.3673   -1.8670   -2.4736   -1.0866   -0.1602   -0.0067    0.0000
    0.0004    0.0214    0.1739   -0.3147   -4.0919   -6.4101   -2.7589   -0.2779    0.0131    0.0020
   -0.0088   -0.0871    0.0364    1.8559    1.4995   -2.2171   -0.2729    0.8368    0.2016    0.0130
   -0.0308   -0.4313   -1.7334   -0.1148    3.0731    0.4444    2.6145    2.4410    0.4877    0.0301
   -0.0336   -0.4990   -2.3552   -2.1722    0.8856   -0.0531    2.6416    2.4064    0.4771    0.0294
   -0.0137   -0.1967   -0.8083    0.2289    3.3983    3.1955    2.4338    1.2129    0.2108    0.0125
   -0.0014   -0.0017    0.3189    2.7414    7.1622    7.1361    3.1242    0.6633    0.0674    0.0030
    0.0002    0.0104    0.1733    1.0852    2.6741    2.6725    1.1119    0.1973    0.0152    0.0005
    0.0000    0.0012    0.0183    0.1099    0.2684    0.2683    0.1107    0.0190    0.0014    0.0000];

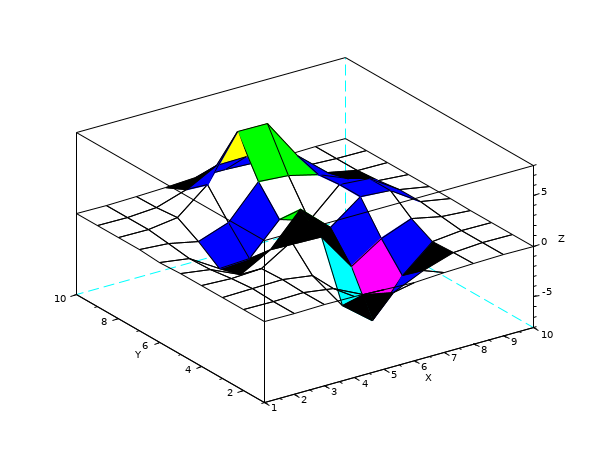
surf(Z,'cdatamapping','direct')
Z= [   0.0001    0.0013    0.0053   -0.0299   -0.1809   -0.2465   -0.1100   -0.0168   -0.0008   -0.0000
    0.0005    0.0089    0.0259   -0.3673   -1.8670   -2.4736   -1.0866   -0.1602   -0.0067    0.0000
    0.0004    0.0214    0.1739   -0.3147   -4.0919   -6.4101   -2.7589   -0.2779    0.0131    0.0020
   -0.0088   -0.0871    0.0364    1.8559    1.4995   -2.2171   -0.2729    0.8368    0.2016    0.0130
   -0.0308   -0.4313   -1.7334   -0.1148    3.0731    0.4444    2.6145    2.4410    0.4877    0.0301
   -0.0336   -0.4990   -2.3552   -2.1722    0.8856   -0.0531    2.6416    2.4064    0.4771    0.0294
   -0.0137   -0.1967   -0.8083    0.2289    3.3983    3.1955    2.4338    1.2129    0.2108    0.0125
   -0.0014   -0.0017    0.3189    2.7414    7.1622    7.1361    3.1242    0.6633    0.0674    0.0030
    0.0002    0.0104    0.1733    1.0852    2.6741    2.6725    1.1119    0.1973    0.0152    0.0005
    0.0000    0.0012    0.0183    0.1099    0.2684    0.2683    0.1107    0.0190    0.0014    0.0000];

surf(Z,'facecol','interp') // 補間影モード (color_flag == 3)
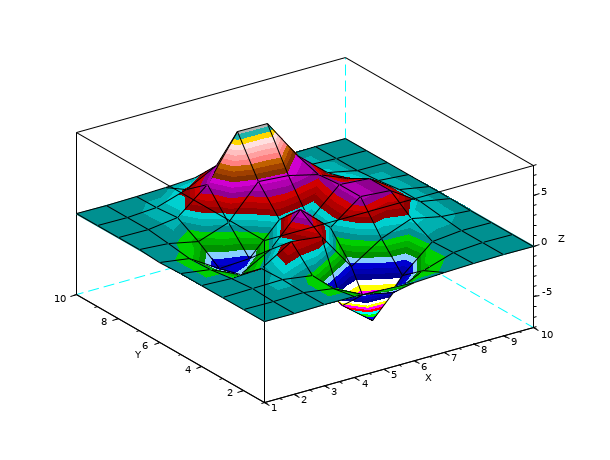
Z= [   0.0001    0.0013    0.0053   -0.0299   -0.1809   -0.2465   -0.1100   -0.0168   -0.0008   -0.0000
    0.0005    0.0089    0.0259   -0.3673   -1.8670   -2.4736   -1.0866   -0.1602   -0.0067    0.0000
    0.0004    0.0214    0.1739   -0.3147   -4.0919   -6.4101   -2.7589   -0.2779    0.0131    0.0020
   -0.0088   -0.0871    0.0364    1.8559    1.4995   -2.2171   -0.2729    0.8368    0.2016    0.0130
   -0.0308   -0.4313   -1.7334   -0.1148    3.0731    0.4444    2.6145    2.4410    0.4877    0.0301
   -0.0336   -0.4990   -2.3552   -2.1722    0.8856   -0.0531    2.6416    2.4064    0.4771    0.0294
   -0.0137   -0.1967   -0.8083    0.2289    3.3983    3.1955    2.4338    1.2129    0.2108    0.0125
   -0.0014   -0.0017    0.3189    2.7414    7.1622    7.1361    3.1242    0.6633    0.0674    0.0030
    0.0002    0.0104    0.1733    1.0852    2.6741    2.6725    1.1119    0.1973    0.0152    0.0005
    0.0000    0.0012    0.0183    0.1099    0.2684    0.2683    0.1107    0.0190    0.0014    0.0000];

scf(10)
axfig10=gca();
scf(11);
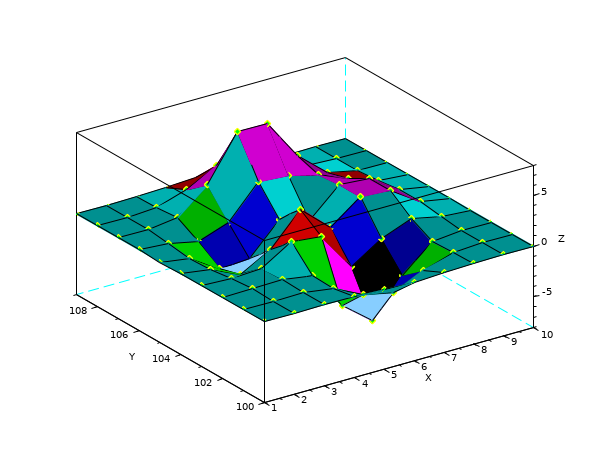
surf(axfig10,Z,'ydat',[100:109],'marker','d','markerfac','green','markeredg','yel') // draw onto the axe of figure 10
参照
履歴
| Version | Description |
| 6.0.2 | The "Foreground", "markForeground", and "markBackground" global properties colors can now be specified as named colors chosen in the full predefined colors list, or by their "#RRGGBB" hexadecimal codes, or by their colormap indices. surf(X,Y,fun..) and surf(X,Y,list(fun, params)) syntaxes added. |
| Report an issue | ||
| << secto3d | 3d_plot | surface_properties >> |