Please note that the recommended version of Scilab is 2026.1.0. This page might be outdated.
See the recommended documentation of this function
param3d
3D plot of a parametric curve
Calling Sequence
param3d(x,y,z,[theta,alpha,leg,flag,ebox])
Arguments
- x,y,z
three vectors of the same size (points of the parametric curve).
- theta, alpha
real values giving in degree the spherical coordinates of the observation point. The default values are 35 and 45 degree.
- leg
string defining the labels for each axis with @ as a field separator, for example "X@Y@Z".
- flag=[type,box]
typeandboxhave the same meaning as inplot3d:- type
an integer (scaling).
- type=0
the plot is made using the current 3D scaling (set by a previous call to
param3d,plot3d,contourorplot3d1).- type=1
rescales automatically 3d boxes with extreme aspect ratios, the boundaries are specified by the value of the optional argument
ebox.- type=2
rescales automatically 3d boxes with extreme aspect ratios, the boundaries are computed using the given data. This is the default value.
- type=3
3d isometric with box bounds given by optional
ebox, similarily totype=1.- type=4
3d isometric bounds derived from the data, similarily
to type=2.- type=5
3d expanded isometric bounds with box bounds given by optional
ebox, similarily totype=1.- type=6
3d expanded isometric bounds derived from the data, similarily to
type=2.Note that axes boundaries can be customized through the axes entity properties (see axes_properties).
- box
an integer (frame around the plot).
- box=0
nothing is drawn around the plot.
- box=1
unimplemented (like box=0).
- box=2
only the axes behind the surface are drawn.
- box=3
a box surrounding the surface is drawn and captions are added.
- box=4
a box surrounding the surface is drawn, captions and axes are added.Note that axes aspect can also be customized through the axes entity properties (see axes_properties). This is the default value.
- ebox
It specifies the boundaries of the plot as the vector
[xmin,xmax,ymin,ymax,zmin,zmax]. This argument is used together withtypeinflag: if it is set to1,3or5(see above to see the corresponding behaviour). Ifflagis missing,eboxis not taken into acoount. Note that, when specified, theeboxargument acts on thedata_boundsfield that can also be reset through the axes entity properties (see axes_properties). The ebox default value is [0,1,0,1,0,1].
Description
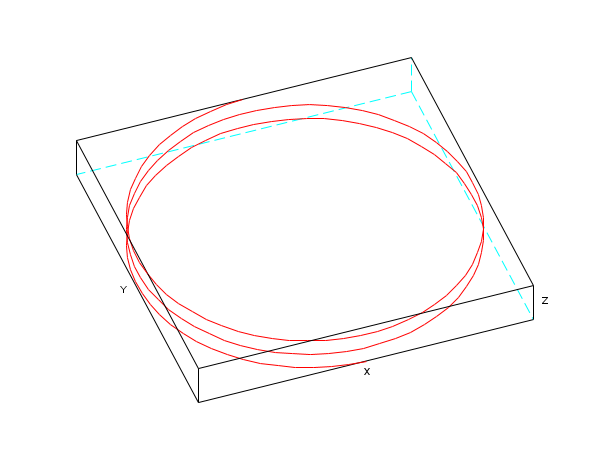
param3d is used to plot a 3D curve defined by its
coordinates x, y and
z. Note that data can also be got or modified through
the surface entity properties (see surface_properties).
Note that properties like rotation angles,
colors and thickness of the plotted
curves can also be got or modified through the polyline entity properties
(see polyline_properties).
Use param3d1 to do multiple plots.
Enter the command param3d() to see a demo.
Examples
t=0:0.1:5*%pi;
param3d(sin(t),cos(t),t/10,35,45,"X@Y@Z",[2,3])

e=gce() //the handle on the 3D polyline

e.foreground=color('red');

a=gca(); //the handle on the axes
a.rotation_angles=[10 70];
| Report an issue | ||
| << mesh | 3d_plot | param3d1 >> |