Please note that the recommended version of Scilab is 2026.1.0. This page might be outdated.
However, this page did not exist in the previous stable version.
hist3d
représentation 3D d'un histogramme
Séquence d'appel
hist3d(mtx,[theta,alpha,leg,flag,ebox])
hist3d(mtx,<opt_args>)
hist3d(list(mtx,x,y),[theta,alpha,leg,flag,ebox])
hist3d(list(mtx,x,y),<opt_args>)
Paramètres
- mtx
matrice de taille (m,n) définissant l'histogramme
mtx(i,j)=F(x(i),y(j)), oùxetysont considérés égaux à0:met0:n.- list(mtx,x,y)
où mtx est une matrice de taille (m,n) définissant l'histogramme
mtx(i,j)=F(x(i),y(j)), avecxetydeux vecteurs de tailles respectives (1,m+1) et (1,n+1).- <opt_args>
Représente une séquence de la forme
clé1=valeur1,
                            clé2=valeur2
,... oùclé1, clé2,...peut être n'importe quel paramètre optionnel de plot3d (theta,alpha,leg,flag,ebox).- theta,alpha,leg,flag,ebox
voir plot3d.
Description
hist3d représente un histogramme 2D dans
l'espace. Les valeurs sont associées aux intervalles [x(i)
x(i+1)[ X [y(i) y(i+1)[
.
Taper hist3d() pour voir une démonstration de la
fonction.
Exemples
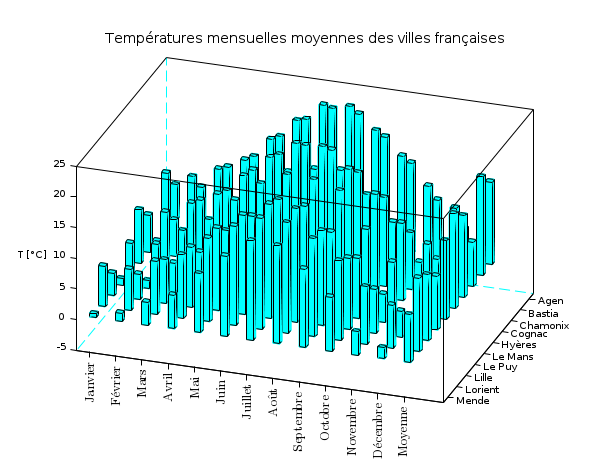
hist3d();
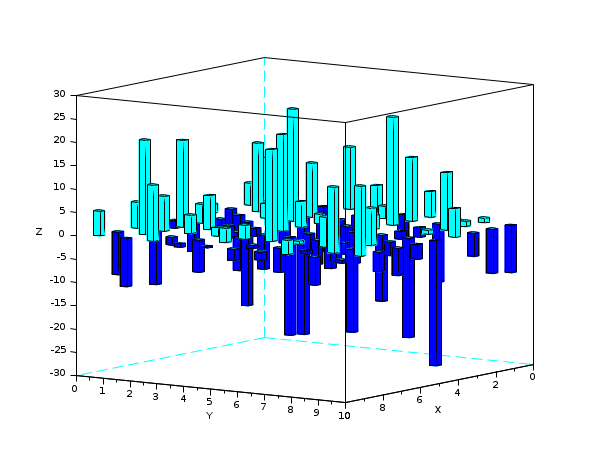
hist3d(10*rand(10,10));
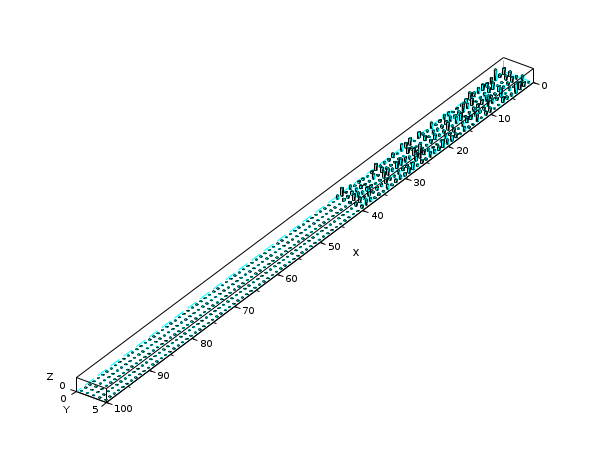
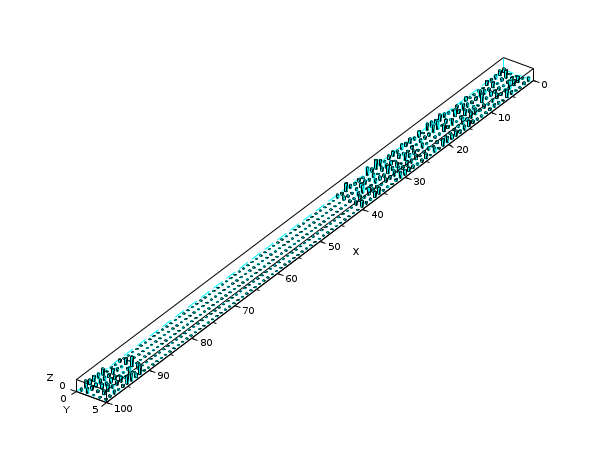
Z = zeros(100,5);
A = abs(rand(40,5));
Z(1:40,:) = A;
Index = find(Z==0);
Z(Index) = %nan;
scf();
hist3d(Z);
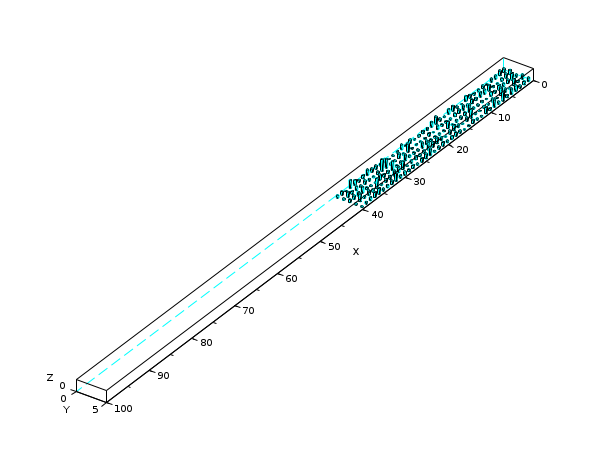
Z = zeros(100,5);
A = abs(rand(40,5));
Z(1:40,:) = A;
A = abs(rand(10,5));
Z(91:100,:) = A;
scf();
hist3d(Z);
| Report an issue | ||
| << geom3d | 3d_plot | milk_drop >> |