Scilab 5.5.0
Please note that the recommended version of Scilab is 2026.1.0. This page might be outdated.
See the recommended documentation of this function
geom3d
projection 3D vers 2D après une instruction de dessin 3D
Séquence d'appel
[x,y]=geom3d(x1,y1,z1)
Paramètres
- x1,y1,z1
vecteur réels de même taille (points 3D).
- x,y
vecteurs réels de même taille que
x1,y1etz1.
Description
Après l'utilisation d'une instruction de dessin 3D du type
plot3d, plot3d1 ou param3d,
geom3d permet de faire la correspondance entre un point de
l'espace 3D (x1(i),y1(i),z1(i)) et le point correspondant
(x(i),y(i)) dans le plan projeté 2D. On peut ainsi utiliser
les primitives graphiques avec (x,y) pour superposer des
dessins.
Exemples
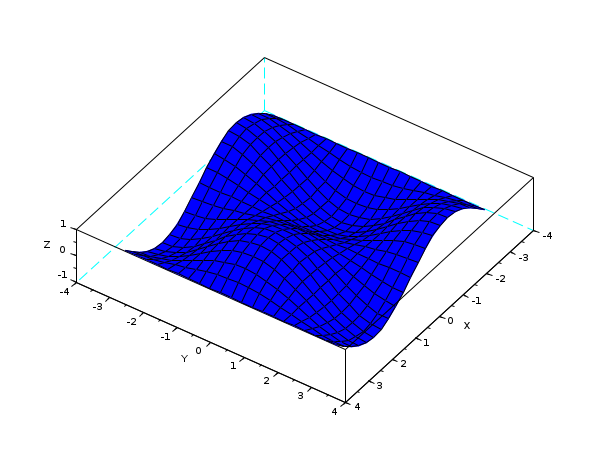
deff("[z]=surface(x,y)","z=sin(x)*cos(y)")
t=%pi*(-10:10)/10;
// 3D plot of the surface
fplot3d(t,t,surface,35,45,"X@Y@Z")
// now (t,t,sin(t).*cos(t)) is a curve on the surface
// which can be drawn using geom3d and xpoly
[x,y]=geom3d(%pi/2,0,surface(%pi/2,0))
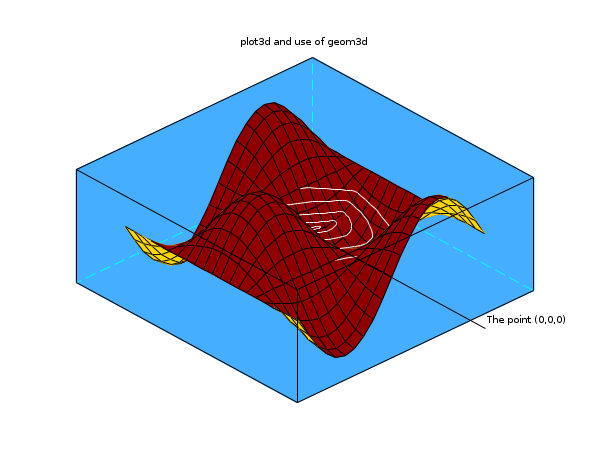
my_plot_desc          = "plot3d and use of geom3d";

  r = (%pi):-0.01:0;
x = r.*cos(10*r);
y = r.*sin(10*r);

deff("[z]=Surf(x,y)","z=sin(x)*cos(y)");
t=%pi*(-10:10)/10;

// Plot the surface'
fplot3d(t,t,Surf,35,45,"X@Y@Z",[19,2,3]);

// Add 2d graphics on 3d graphic'
z=(sin(x).*cos(y));
[x1,y1] = geom3d(x,y,z);
xpoly(x1,y1,"lines");

// Adjust some plotting parameters'
BackgroundColorId           = color(70,174,255);
current_axe                 = gca();
plot_3d                     = current_axe.children(2);
plot_3d.hiddencolor         = 32;
polyline                    = current_axe.children(1)';;
polyline.foreground         = 8;
current_axe.rotation_angles = [70,47];
current_axe.background      = BackgroundColorId;

// A second 2d graphics'
[x1,y1] = geom3d([0,0],[0,0],[5,0]);
xsegs(x1,y1);
xstring(x1(1),y1(1),"The point (0,0,0)");

xtitle(my_plot_desc," "," "," ");
| Report an issue | ||
| << genfac3d | 3d_plot | hist3d >> |