Please note that the recommended version of Scilab is 2026.1.0. This page might be outdated.
However, this page did not exist in the previous stable version.
param3d1
3D plot of parametric curves
Calling Sequence
param3d1(x,y,z,[theta,alpha,leg,flag,ebox])
param3d1(x,y,list(z,colors),[theta,alpha,leg,flag,ebox])
Arguments
- x,y,z
matrices of the same size (nl,nc).
Each column i of the matrices corresponds to the coordinates of the ith curve. You can give a specific color for each curve by using
list(z,colors)instead ofz, wherecolorsis a vector of sizenc. Ifcolor(i)is negative the curve is plotted using the mark with idabs(style(i)); ifstyle(i)is strictly positive, a plain line with color idstyle(i)or a dashed line with dash idstyle(i)is used.- theta,alpha
real values giving in degree the spherical coordinates of the observation point. The default values are 35 and 45 degree.
- leg
string defining the captions for each axis with @ as a field separator, for example "X@Y@Z".
- flag=[type,box]
typeandboxhave the same meaning as inplot3d:- type
an integer (scaling).
- type=0
the plot is made using the current 3D scaling (set by a previous call to
param3d,plot3d,contourorplot3d1).- type=1
rescales automatically 3d boxes with extreme aspect ratios, the boundaries are specified by the value of the optional argument
ebox.- type=2
rescales automatically 3d boxes with extreme aspect ratios, the boundaries are computed using the given data. This is the default value.
- type=3
3d isometric with box bounds given by optional
ebox, similarily totype=1.- type=4
3d isometric bounds derived from the data, similarily
to type=2.- type=5
3d expanded isometric bounds with box bounds given by optional
ebox, similarily totype=1.- type=6
3d expanded isometric bounds derived from the data, similarily to
type=2.Note that axes boundaries can be customized through the axes entity properties (see axes_properties).
- box
an integer (frame around the plot).
- box=0
nothing is drawn around the plot.
- box=1
unimplemented (like box=0).
- box=2
only the axes behind the surface are drawn.
- box=3
a box surrounding the surface is drawn and captions are added.
- box=4
a box surrounding the surface is drawn, captions and axes are added.Note that axes aspect can also be customized through the axes entity properties (see axes_properties). This is the default value.
- ebox
It specifies the boundaries of the plot as the vector
[xmin,xmax,ymin,ymax,zmin,zmax]. This argument is used together withtypeinflag: if it is set to1,3or5(see above to see the corresponding behaviour). Ifflagis missing,eboxis not taken into acount. Note that, when specified, theeboxargument acts on thedata_boundsfield that can also be reset through the axes entity properties (see axes_properties). Theeboxdefault value is[0,1,0,1,0,1].
Description
param3d1 is used to plot 3D curves defined by
their coordinates x, y and
z. Note that data can also be got or modified through
the surface entity properties (see surface_properties).
Note that properties like rotation angles,
colors and thickness of the plotted
curves can also be got or modified through the polyline entity properties
(see polyline_properties).
Enter the command param3d1() to see a
demo.
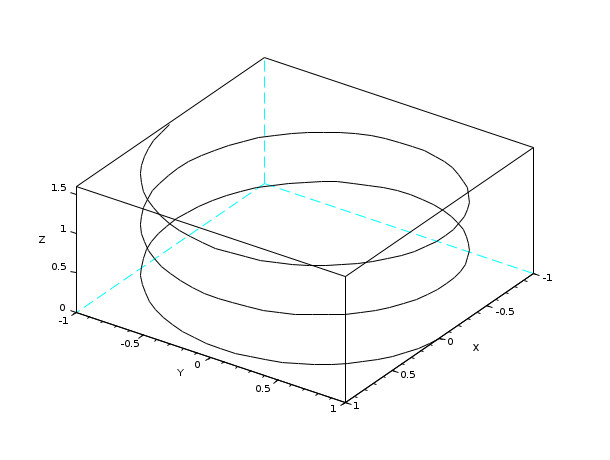
Examples
xset('window',20) // create a window number 20
t=[0:0.1:5*%pi]';
param3d1([sin(t),sin(2*t)],[cos(t),cos(2*t)],..
         list([t/10,sin(t)],[3,2]),35,45,"X@Y@Z",[2,3])

xdel(20);
a=gca();//get the handle of the newly created axes
t=[0:0.1:5*%pi]';
param3d1([sin(t),sin(2*t)],[cos(t),cos(2*t)],[t/10,sin(t)]);
a.rotation_angles=[65,75];
a.data_bounds=[-1,-1,-1;1,1,2]; //boundaries given by data_bounds
a.thickness = 2;
h=a.children; //get the handle of the param3d entity: an Compound composed of 2 curves
h.children(1).foreground = 3; // first curve
curve2 = h.children(2);
curve2.foreground = 6;
curve2.mark_style = 2;
See Also
| Report an issue | ||
| << param3d | 3d_plot | param3d properties >> |