Please note that the recommended version of Scilab is 2026.1.0. This page might be outdated.
However, this page did not exist in the previous stable version.
hist3d
3D representation of a histogram
Calling Sequence
hist3d(mtx,[theta,alpha,leg,flag,ebox])
hist3d(mtx,<opt_args>)
hist3d(list(mtx,x,y),[theta,alpha,leg,flag,ebox])
hist3d(list(mtx,x,y),<opt_args>)
Arguments
- mtx
matrix of size (m,n) defining the histogram
mtx(i,j)=F(x(i),y(j)), wherexandyare taken as0:mand0:n.- list(mtx,x,y)
where mtx is a matrix of size (m,n)defining the histogram
mtx(i,j)=F(x(i),y(j)), withxandyvectors of size (1,m+1) and (1,n+1).- <opt_args>
This represents a sequence of statements
key1=value1,
                            key2=value2
,... wherekey1,key2,...can be one of the following: theta, alpha,leg,flag,ebox. See plot3d.- theta,alpha,leg,flag,ebox
see plot3d.
Description
hist3d represents a 2d histogram as a 3D plot.
The values are associated to the intervals [x(i) x(i+1)[ X [y(i)
y(i+1)[
.
Enter the command hist3d() to see a demo.
Examples
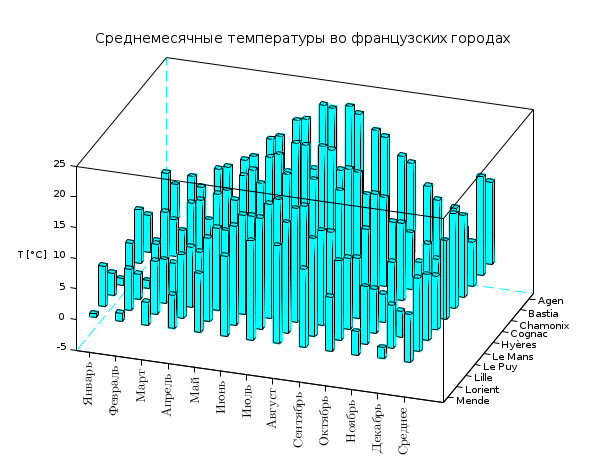
hist3d();
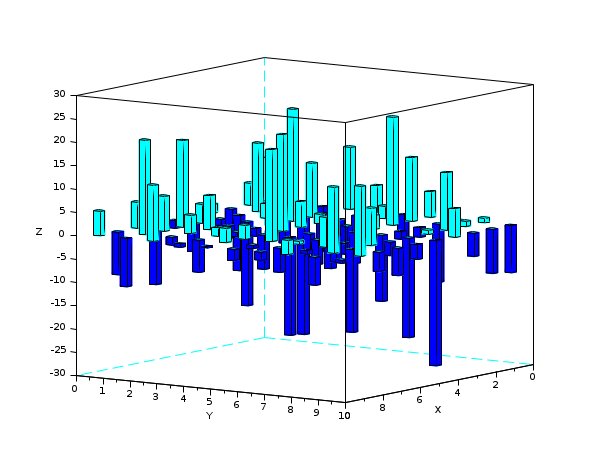
hist3d(10*rand(10,10));
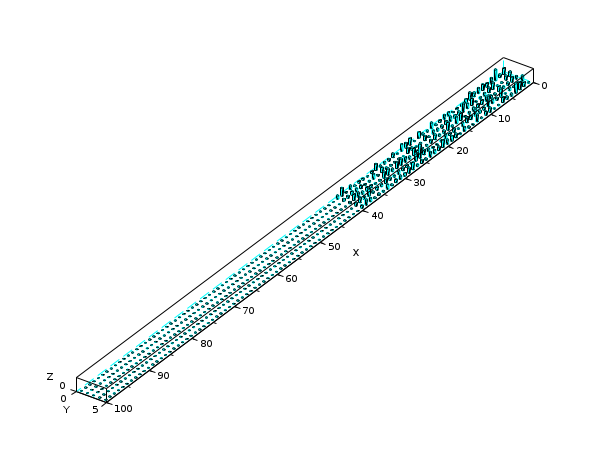
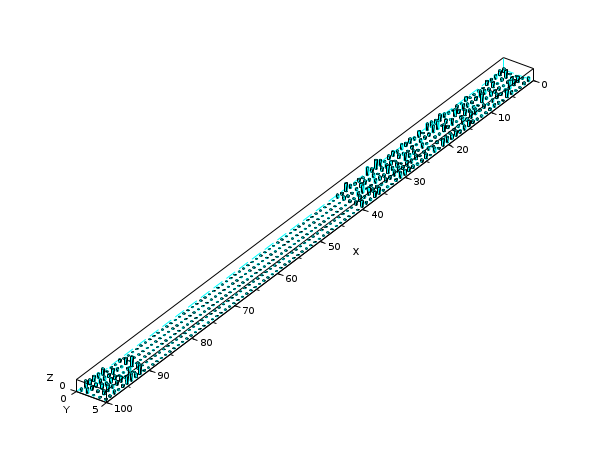
Z = zeros(100,5);
A = abs(rand(40,5));
Z(1:40,:) = A;
Index = find(Z==0);
Z(Index) = %nan;
scf();
hist3d(Z);
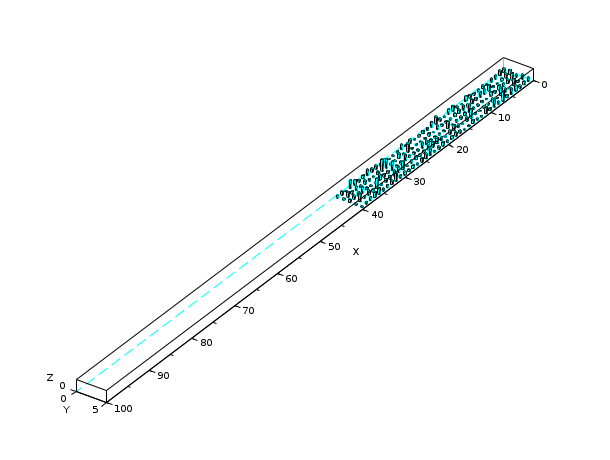
Z = zeros(100,5);
A = abs(rand(40,5));
Z(1:40,:) = A;
A = abs(rand(10,5));
Z(91:100,:) = A;
scf();
hist3d(Z);
| Report an issue | ||
| << geom3d | 3d_plot | milk_drop >> |