Please note that the recommended version of Scilab is 2026.1.0. This page might be outdated.
See the recommended documentation of this function
tree_show
Displays a tree view of a list, tlist, mlist, cell or structure array, Xcos block
Syntax
tree_show(x)
tree_show(x, rootTitle)
tree_show(x, rootTitle, styles)
tree_show(x, rootTitle, styles, arrayByFields)
Arguments
- x
Container to display. Supported containers: list, mlist, tlist, array of cells, array of structures, identifier of an Xcos block. Other containers may be nested in
x.- rootTitle
Single string: explicit label of the tree's root, for instance the name of the
xvariable in the calling environment. Default = "". HTML.4 styling tags can be used to change the style of the root's title. Example: "
<html><font color="red"><b>The title</b>" will display The title in bold red.- styles
Single string = HTML.4 styling tag, including the "$" character that will be replaced with the address (fields names, lists indices..) of each data.
The
stylesoption can be used to customize the style either of addresses, or of related contents, or both. Examples:"<b>$</b>": address in bold, content in normal black."$<i>": address in normal black, content in italic."<i>$": both address and content in italic."<font color=''grey''>$</font><i>": address in grey, content in italic.
Default =
"<font color=""blue"">$</font>"(address in blue, content in black).Setting
""removes styling.- arrayByFields
Single boolean, used only for arrays of structures:
%T : For each field of the struct, the array of its values is displayed. %F : For each structure of the array, its fields and their values are displayed. The chosen display mode is used as well for every nested array of structures, at any depths.
Description
Creates a window and displays a tree view of the given container.
 | The window has no handle. |
Examples
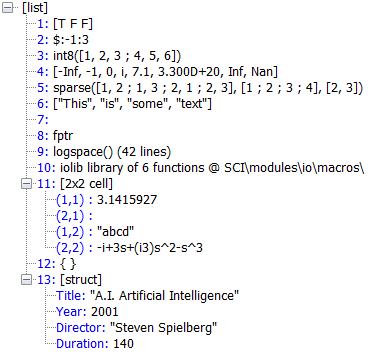
list(), including a cells array :
films = struct("Title", "A.I. Artificial Intelligence",.. "Year", 2001, .. "Director", "Steven Spielberg", .. "Duration", 140); L = list([%t %f %f], .. $:-1:3, .. int8([1 2 3 ; 4 5 6]), .. [-%inf, -1, 0, %i, 7.1, 3.3e20, %inf, %nan], .. sparse([0 1 2; 3 0 4]), .. ["This" "is" "some" "text"], .. , .. sin, .. logspace, .. iolib, .. {%pi, "abcd" ; list(,)(1),(%i-%s)^3}, .. {}, .. films); tree_show(L) |
 |
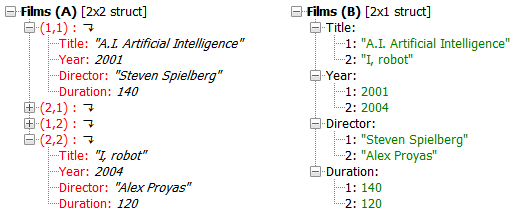
Using the rootTitle and styles options :
// Data to display:
clear films
films(1) = struct("Title", "A.I. Artificial Intelligence",..
                  "Year", 2001, ..
                  "Director", "Steven Spielberg", ..
                  "Duration", 140);
films(2,2) = struct("Title", "I, robot", ..
                    "Year", 2004, ..
                    "Director", "Alex Proyas", ..
                    "Duration", 120);

// Styling both the addresses and the contents:
mainTitle = "<html><b>Films (A)</b>";
tree_show(films, mainTitle , "<font color=""red"">$</font><i>");

// Styling only the contents:
mainTitle = "<html><b>Films (B)</b>";
tree_show(films([1 4]), mainTitle, "$<font color=""green"">", %t);
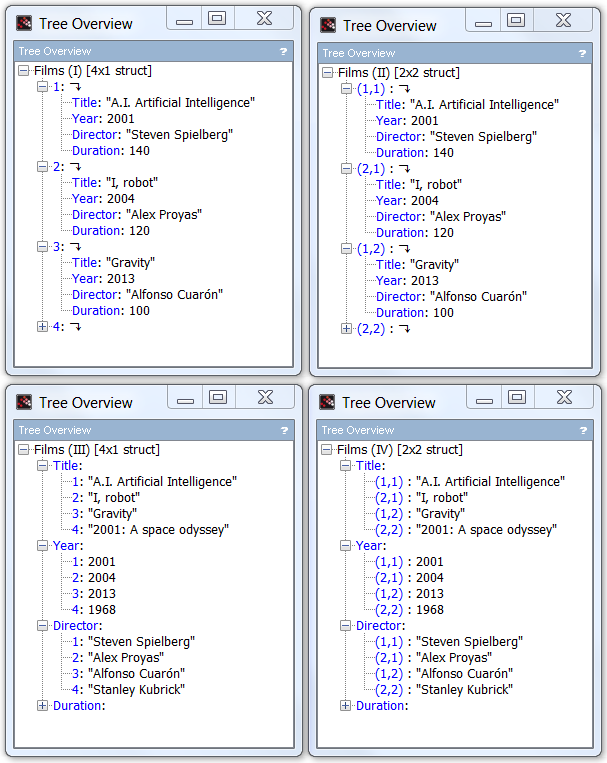
Array of structures :
clear films
films(1) = struct("Title", "A.I. Artificial Intelligence",..
              "Year", 2001, ..
              "Director", "Steven Spielberg", ..
              "Duration", 140);
films(2) = struct("Title", "I, robot", ..
              "Year", 2004, ..
              "Director", "Alex Proyas", ..
              "Duration", 120);
films(1,2) = struct("Title", "Gravity", ..
                "Year", 2013, ..
                "Director", "Alfonso Cuarón", ..
                "Duration", 100);
films(2,2) = struct("Title", "2001: A space odyssey", ..
                "Year", 1968, ..
                "Director", "Stanley Kubrick", ..
                "Duration", 141);

tree_show(films(:),"Films (I)");
tree_show(films   ,"Films (II)");
tree_show(films(:),"Films (III)", , %t);
tree_show(films   ,"Films (IV)" , , %t);
2x2 struct array with fields:
   Title
   Director
   Year
   Duration
With a custom tlist or mlist :
// For a mlist:
str = ['a','b','c','d','e','f','g','h'];
n = matrix(str, [2,2,2]);
v = matrix(1:8, [2,2,2]);
Mm = mlist(['V','name','value'],n,v);
tree_show(Mm);

// For a tlist:
Mt = tlist(['V','name','value'],['a','b','c'],[1 2 3]);
tree_show(Mt);
For an Xcos block :
loadXcosLibs();

blk = BIGSOM_f("define");
tree_show(blk)
See Also
- uiDisplayTree — Printing an uitree in GUI mode
- uiDumpTree — Printing an uitree in the console (text mode)
- prettyprint — Converts a Scilab object into some corresponding LaTeX, TeX, MathML or HTML strings
- editvar — Scilab variable editor
- browsevar — Scilab variable browser
History
| Version | Description |
| 6.1.0 |
|
| Report an issue | ||
| << tlist | Listes Structures Cells | vec2list >> |