- Ajuda do Scilab
- Biblioteca de Gráficos
- 2d_plot
- 3d_plot
- annotation
- axes_operations
- axis
- bar_histogram
- Color management
- Datatips
- figure_operations
- geometric_shapes
- handle
- interaction
- load_save
- polygon
- property
- text
- transform
- lighting
- Compound properties
- GlobalProperty
- Graphics
- graphics_entities
- object_editor
- pie
- multiscaled plots
- xchange
- xget
- xset
Please note that the recommended version of Scilab is 2026.1.0. This page might be outdated.
See the recommended documentation of this function
Graphics
Resumo da biblioteca de gráficos
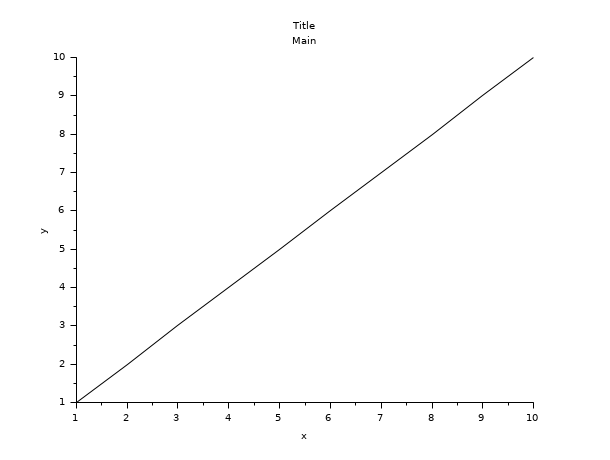
Desenhos 2d
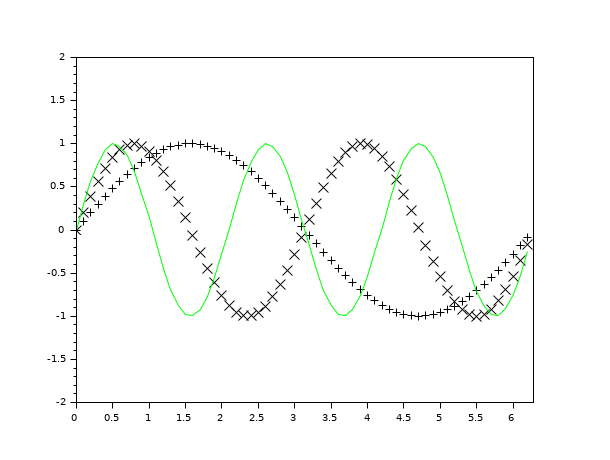
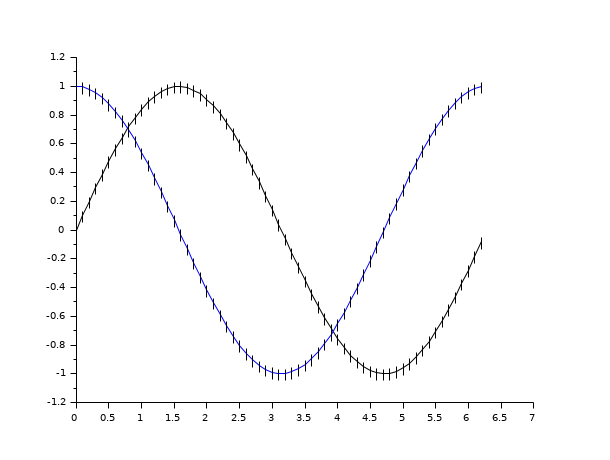
- plot2d
Esboço 2d
Examplo:
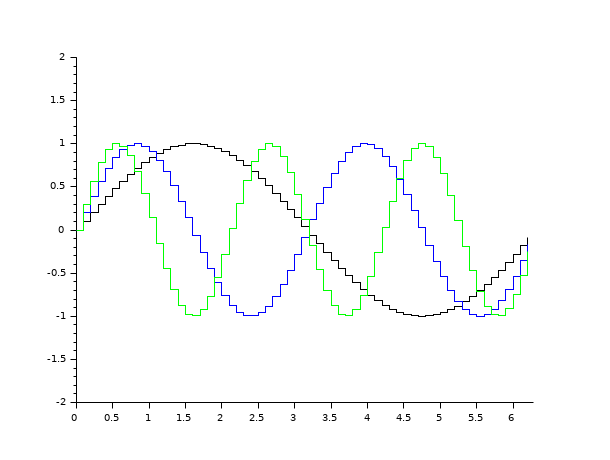
- plot2d2
Esboço 2d (funções de degraus)
Examplo:
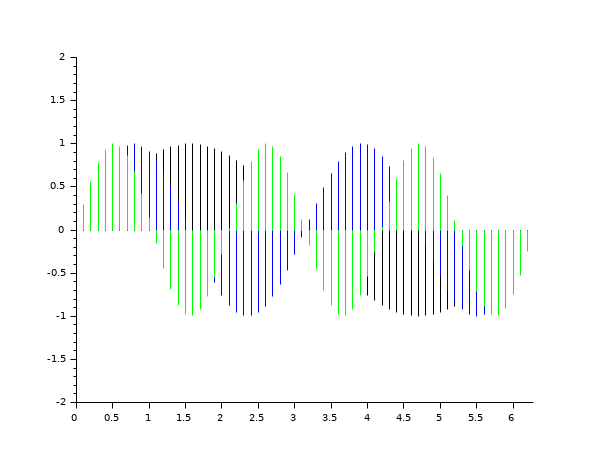
- plot2d3
Esboço 2d (barras veticais)
Examplo:
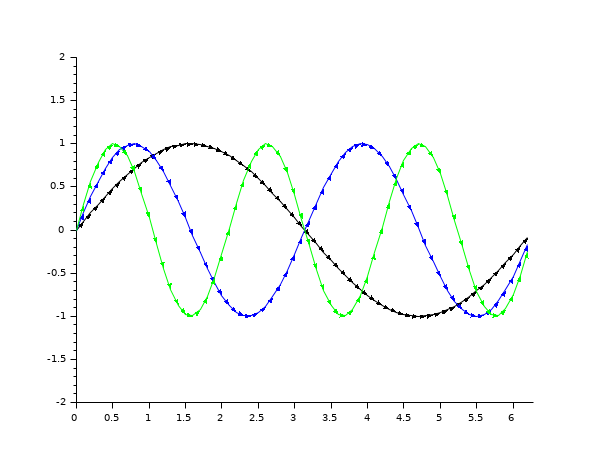
- plot2d4
Esboço 2d (setas)
Examplo:
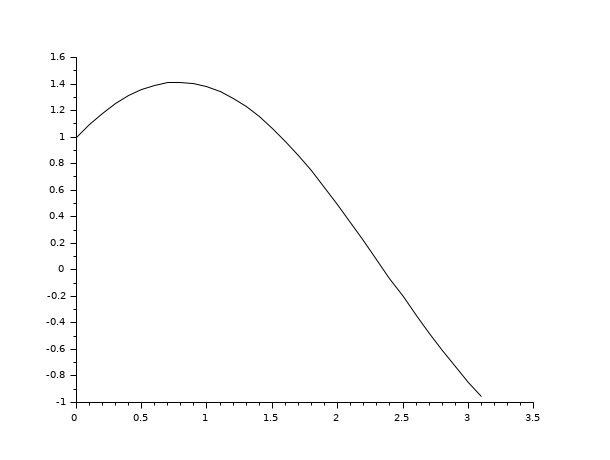
- fplot2d
esboço 2d de uma curva definida por uma função
Examplo:
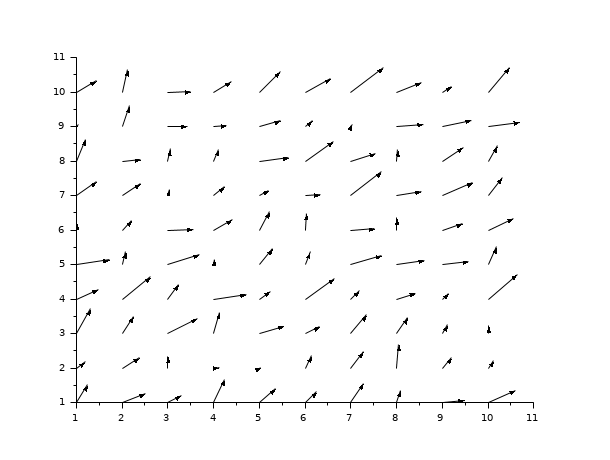
- champ
esboço de campo vetorial 2d
Examplo:
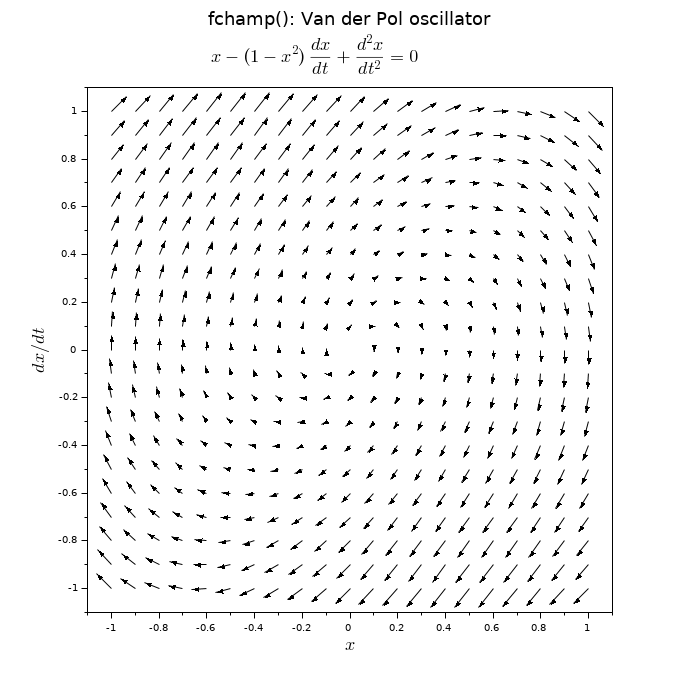
- fchamp
campo direcional de uma EDO 2d de primeira ordem
Examplo:
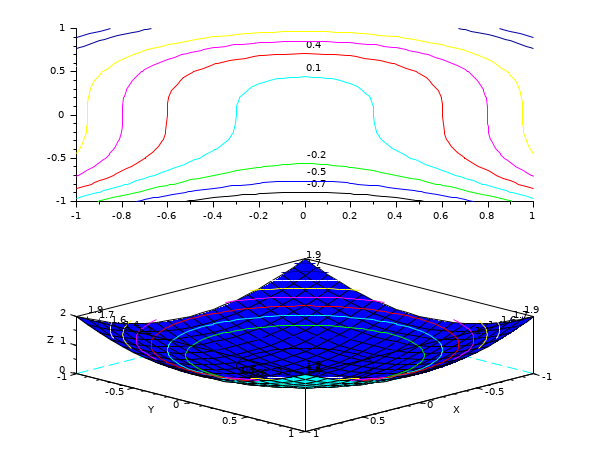
- contour2d
curvas de nível de uma superfície em um esboço 2d
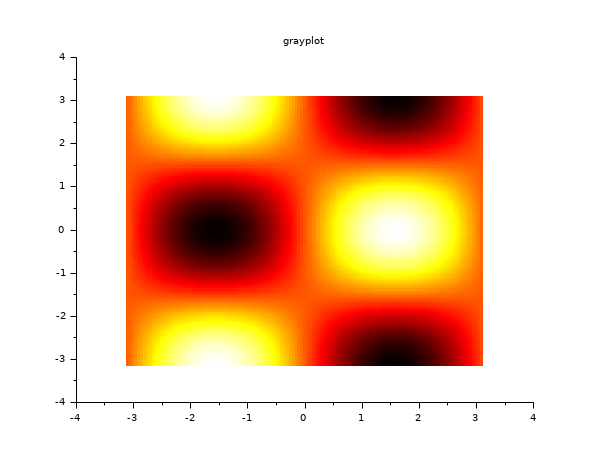
- grayplot
esboço 2d de uma superfície utilizando-se cores
Examplo:
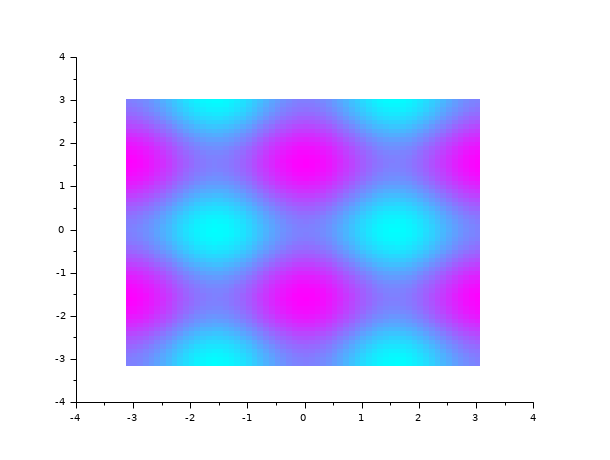
- fgrayplot
esboço 2d de uma superfície definida por uma função utilizando cores
Examplo:
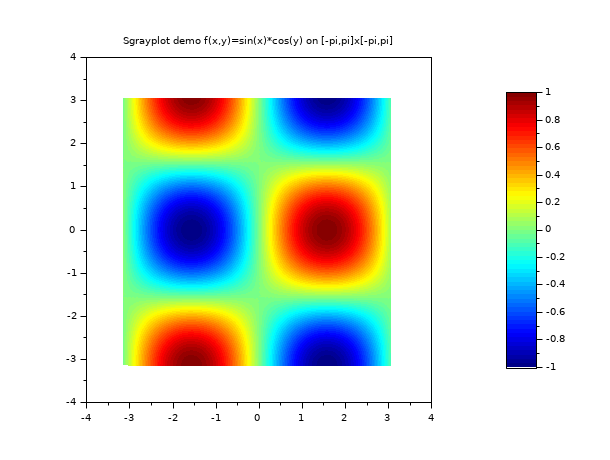
- Sgrayplot
esboço 2d suave de uma superfície utilizando cores
Examplo:
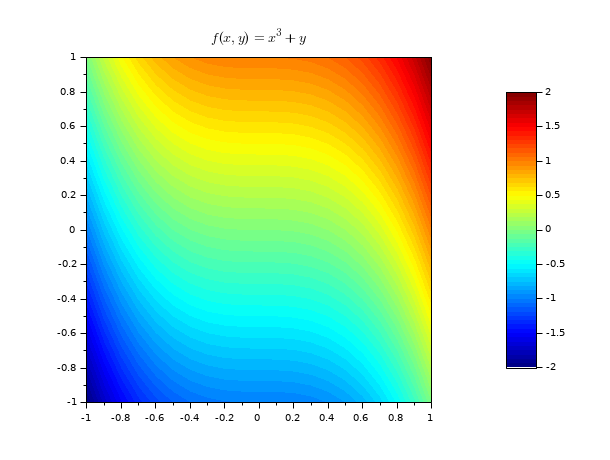
- Sfgrayplot
esboço 2d suave de uma superfície definida por uma função utilizando cores
Examplo:
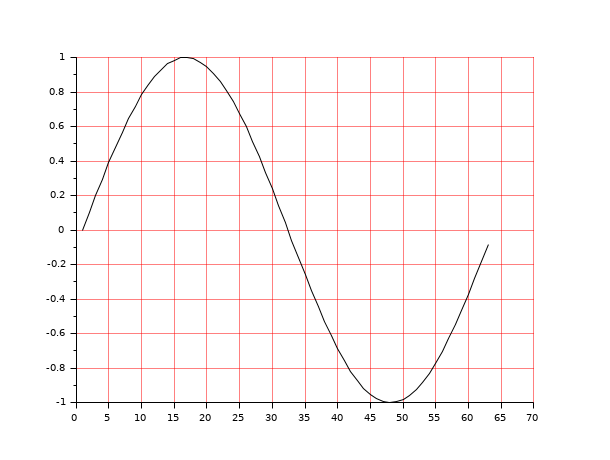
- xgrid
adiciona um grid em um esboço 2d
Examplo:
- errbar
adiciona barras de erro veriticais a um esboço 2d
Examplo:
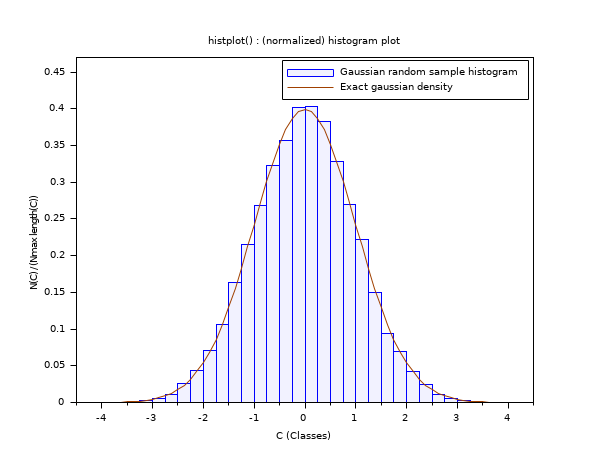
- histplot
esboça um histograma
Examplo:
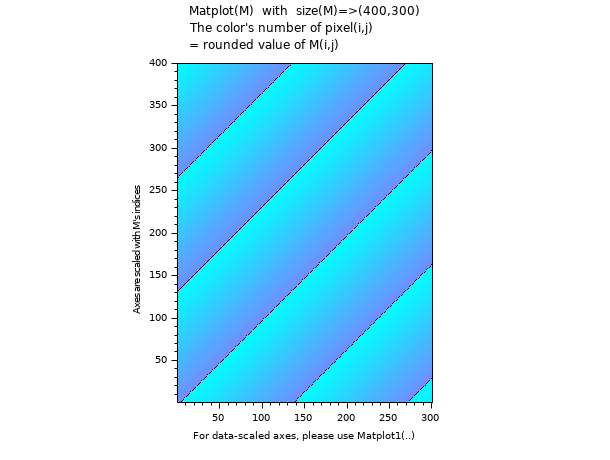
- Matplot
esboço 2d de uma matriz utilizando-se cores
Examplo:
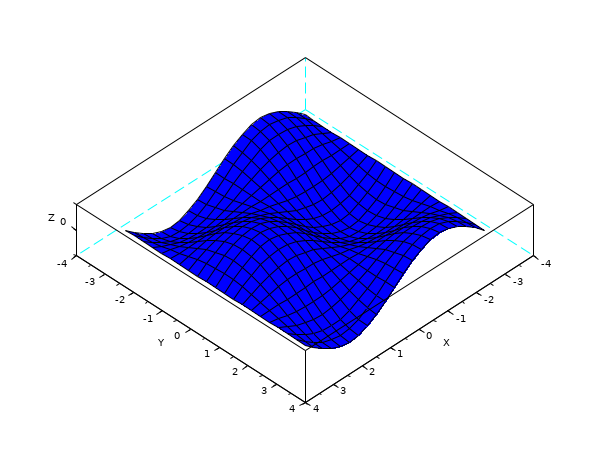
Desenhos 3d
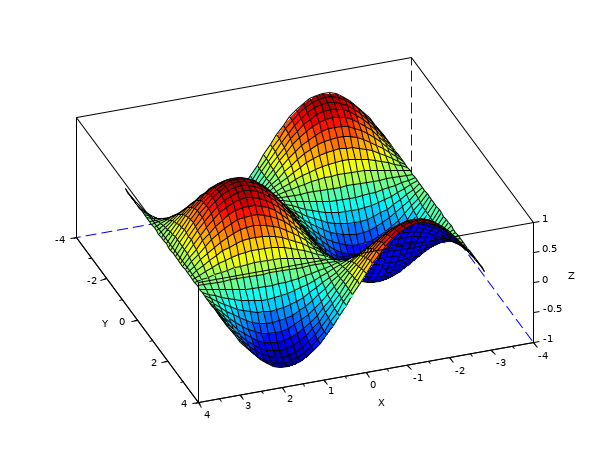
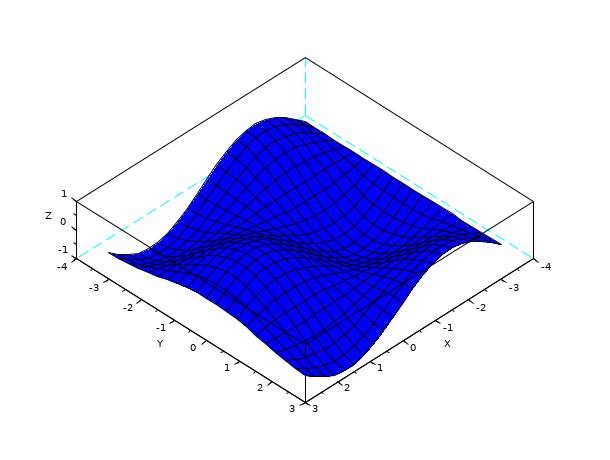
- plot3d
esboço 3d de uma superfície
Examplo:

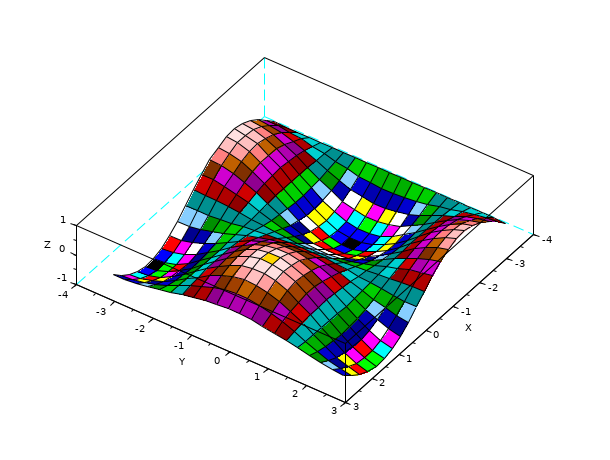
- plot3d1
esboço 3d em níveis de cinza ou de cores de uma superfície
Examplo:
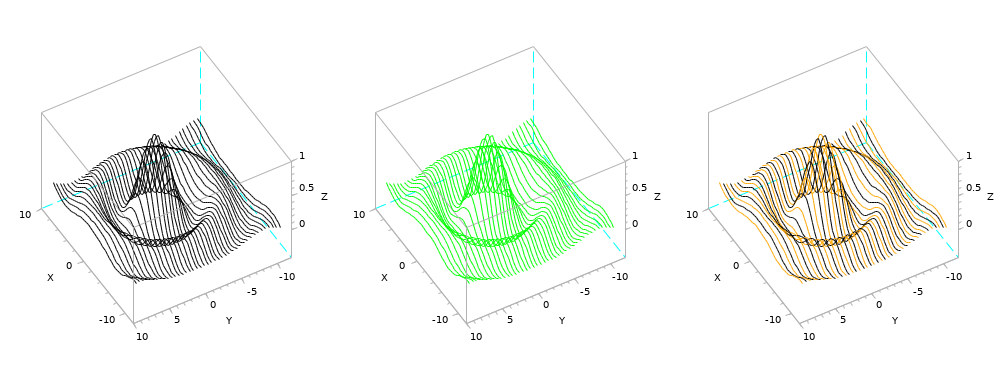
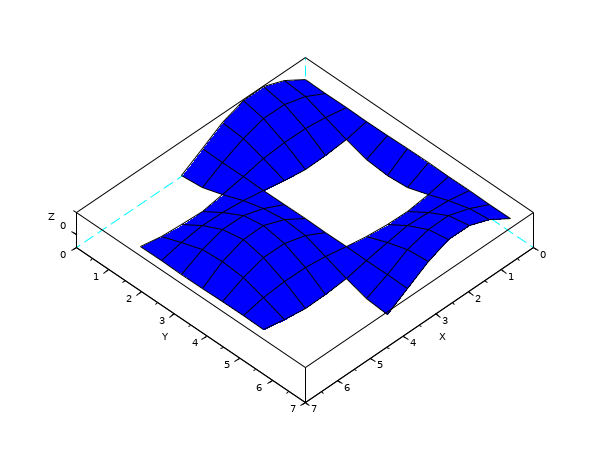
- fplot3d
esboço 3d de uma superfície definida por uma função
Examplo:
- fplot3d1
esboço 3d em escala de cinza ou colorido de nível de uma superfície definida por uma função
Examplo:
- param3d
esboço 3d de uma curva parametrizada
Examplo:
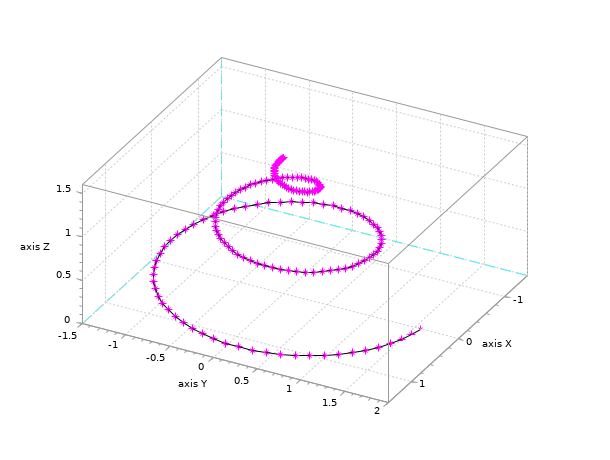
- param3d1
esboço 3d de curvas parametrizadas
Examplo:
- contour
curvas de nível em uma superfície 3d
Examplo:
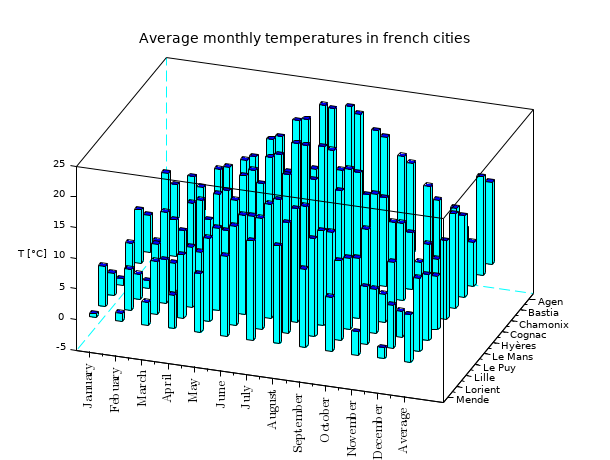
- bar3d
representação 3D do diagrama de barras
Examplo:
- genfac3d
computa facetas de uma superfície 3d
Examplo:
- eval3dp
computa facetas 3d de uma superfície parametrizada
Examplo:
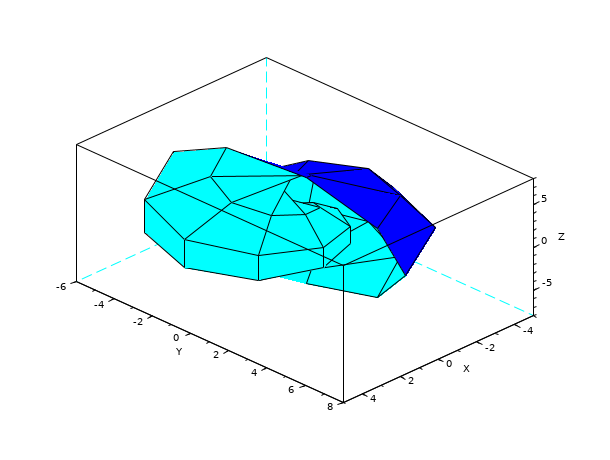
- geom3d
projeção 3d para 2d após um esboço 3d
Examplo:
Desenho de linhas e poligonais
Desenho de retângulos
Desenho de arcos
Arrow plotting
- xarrows
Draw a set of arrows
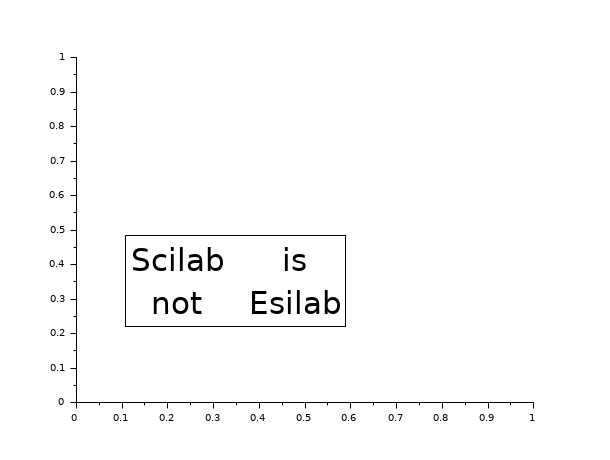
Strings
Frames and axes
Coordinates transformations
Colors
- colormap
Using colormaps
- getcolor
Dialog to select colors in the current colormap
- addcolor
Add new colors to the current colormap
- graycolormap
Linear gray colormap
- hotcolormap
Red to yellow colormap
Graphics context
Save and load
- xsave
Save graphics into a file
- xload
Load a saved graphics
- xs2bmp
Export graphics using the BMP format
- xs2emf
Export graphics using the EMF format
 Only under Windows.
- xs2eps
Export graphics using the EPS format
- xs2gif
Export graphics using the GIF format
- xs2jpg
Export graphics using the JPG format
- xs2pdf
Export graphics using the PDF format
- xs2png
Export graphics using the PNG format
- xs2ppm
Export graphics using the PPM format
- xs2ps
Export graphics using the PS format
- xs2svg
Export graphics using the SVG format
Graphics primitives
- clf
Clear or reset the current graphic figure (window) to default values
- driver
Select a graphics driver
- xinit
Initialisation of a graphics driver
- xend
Close a graphics session
- replot
Redraw the current graphics window with new boundaries
- show_window
Raise the current graphics window
- xdel
Delete a graphics window
- winsid
Return the list of graphics windows
- xname
Change the name of the current graphics window
Mouse position
Interactive editor
- edit_curv
Interactive graphics curve editor
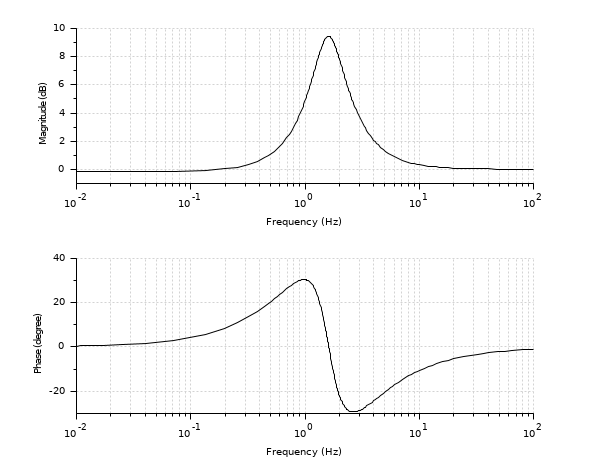
Graphics functions for automatic control
- bode
Bode plot
Examplo:
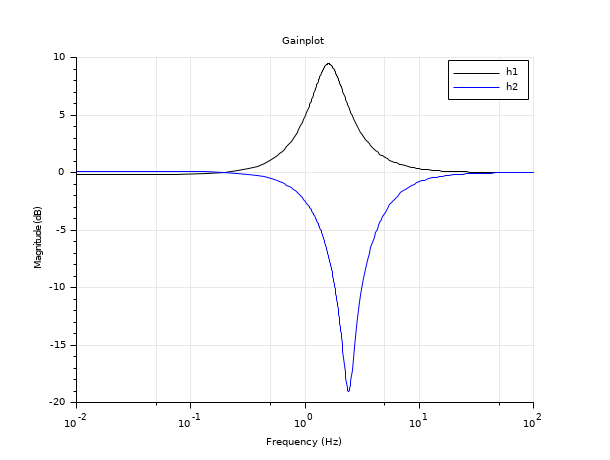
- gainplot
Magnitude plot
Examplo:
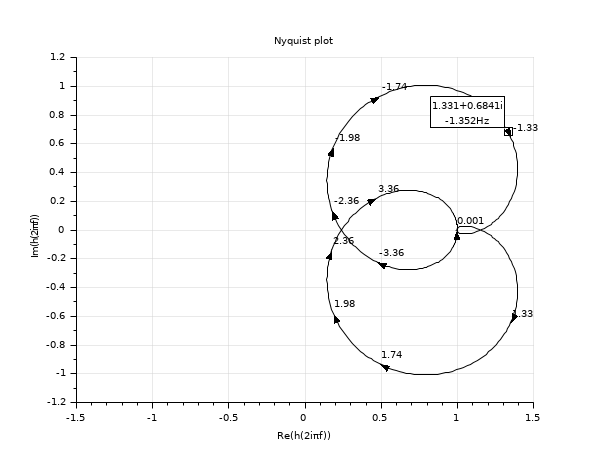
- nyquist
Nyquist plot
Examplo:
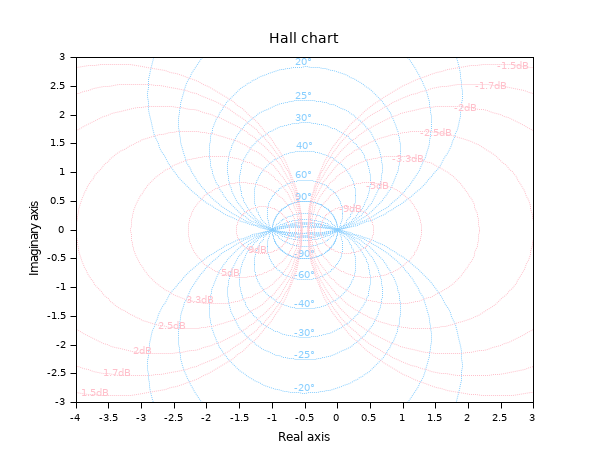
- hallchart
Hall chart
Examplo:
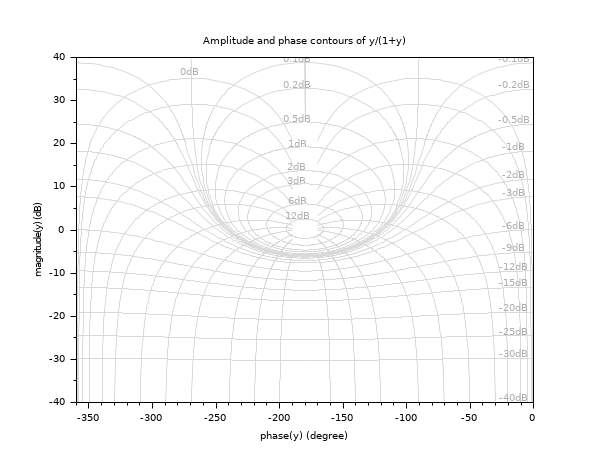
- nicholschart
Nichols chart
Examplo:
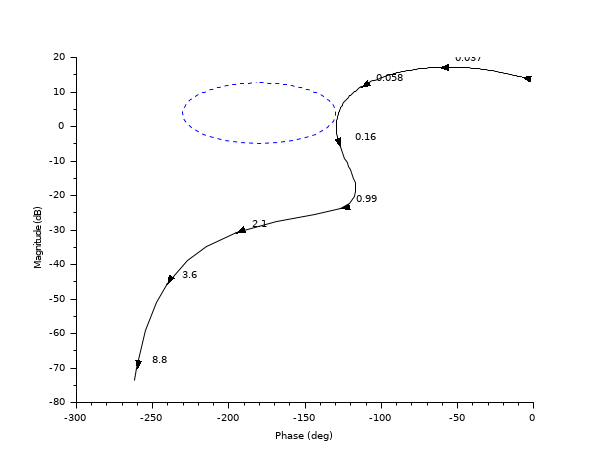
- black
Black's diagram
Examplo:
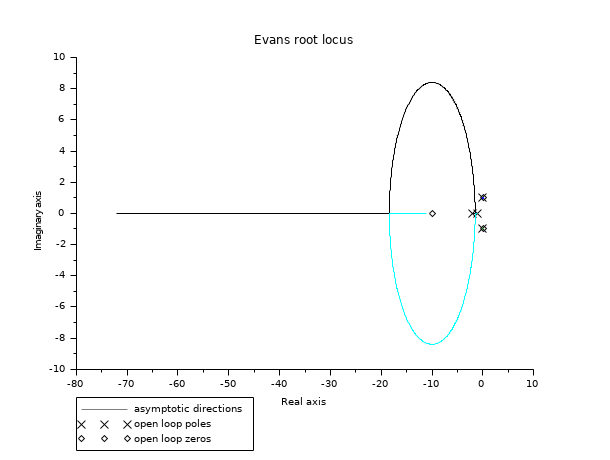
- evans
Evans root locus
Examplo:
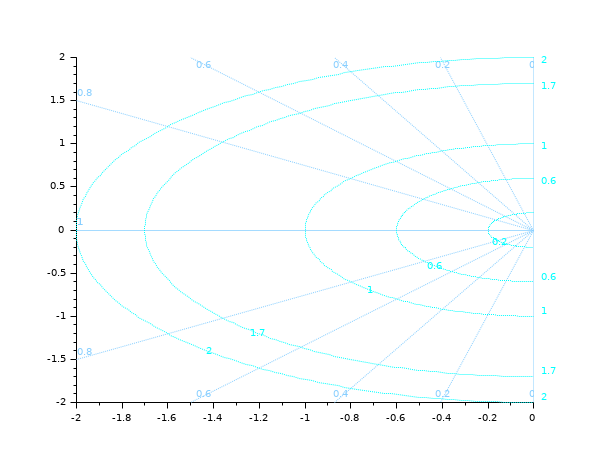
- sgrid
s-plane grid lines
Examplo:
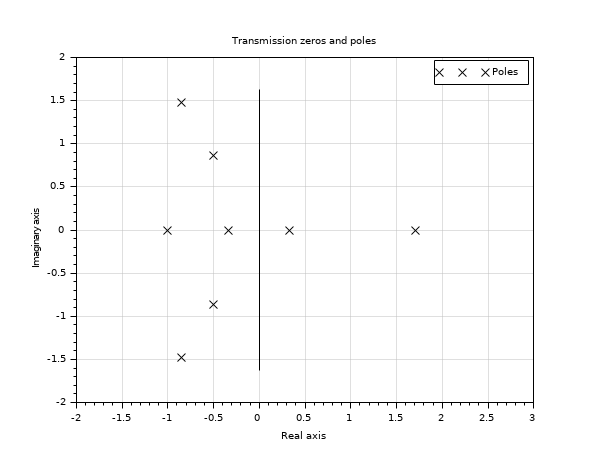
- plzr
pole-zero plot
Examplo:
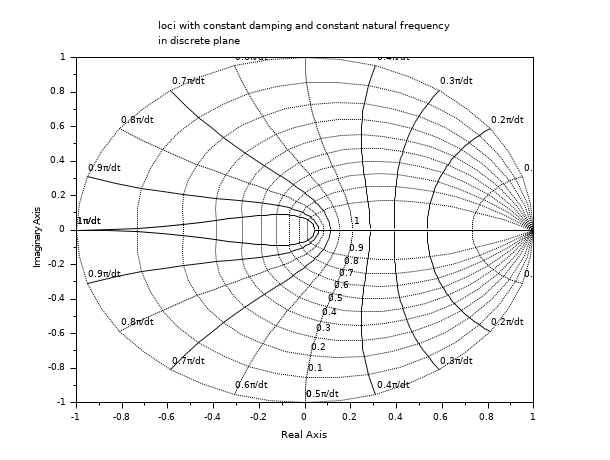
- zgrid
zgrid plot
Examplo:
| Report an issue | ||
| << GlobalProperty | Biblioteca de Gráficos | graphics_entities >> |