Scilab 6.1.0
Please note that the recommended version of Scilab is 2026.1.0. This page might be outdated.
See the recommended documentation of this function
zgrid
esboçode um z-grid
Seqüência de Chamamento
zgrid()
Descrição
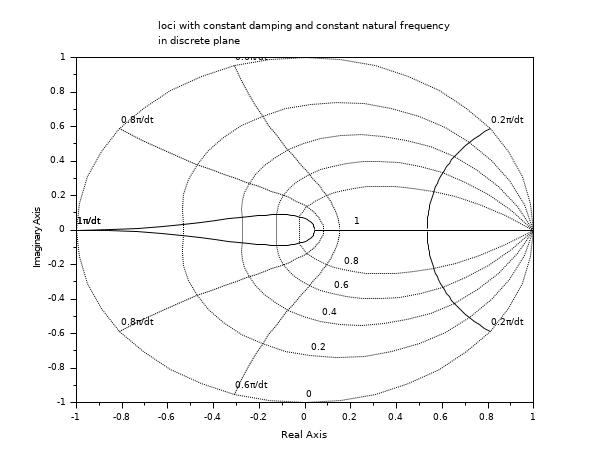
Esboça as linhas de grid de um Z-plano: linhas de fator constante de amortecimento (zeta) e freqüência natural (Wn) são esboçadas dentro do círculo unitário do Z-plano.
Curvas de iso-freqüência são exibidas em freqüência*passo no
intervalo [0,0.5]. O limite superior corresponde à freqüência de Shannon
( 1/dt > 2*f ).
Examplos
//zgrid
clf();zgrid(0:0.2:1,[0.2 0.6 0.8 1])
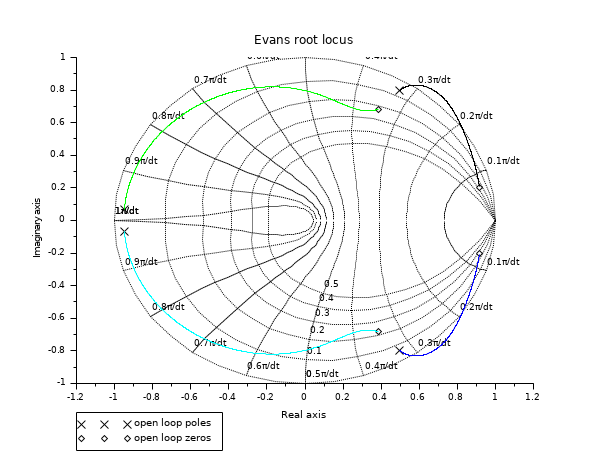
//zgrid with discrete time system  root locus
z=poly(0,'z')
H=syslin(0.01,(0.54-1.8*z+2.9*z^2-2.6*z^3+z^4)/(0.8+0.78*z-0.1*z^2+0.9*z^3+z^4))
clf();evans(H,1000);zgrid(0:0.1:0.5)
Ver Também
| Report an issue | ||
| << st_ility | Stability | Time Domain >> |