Scilab 6.1.0
Please note that the recommended version of Scilab is 2026.0.0. This page might be outdated.
See the recommended documentation of this function
meshgrid
construit des matrices ou hypermatrices en répliquant des vecteurs en 2 ou 3 dimensions
Séquence d'appel
U = meshgrid(u)
[U, V] = meshgrid(u)
[X, Y] = meshgrid(x, y)
[X, Y, Z] = meshgrid(x, y, z)
Paramètres
- u, x, y, z
- Vecteurs de types quelconques, de tailles nu, nx, ny, nz.
- U, V
- Matrices carrées, de taille nu x nu
- X, Y, Z
- Matrices ou hypermatrices de mêmes tailles [ny, nx] ou [ny, nx, nz].
Description
meshgrid(..) construit des matrices ou des hypermatrices 3-D par réplication en 2 ou 3 dimensions des vecteurs donnés.
 | Pour créer des tableaux de taille [nx, ny]
au lieu de [ny, nx], ou avec plus de 3
dimensions, utiliser ndgrid(x, y) ou
ndgrid(x, y, z,..). |
 | La plupart des fonctions graphiques 2D ou 3D de Scilab telles que
champ(),
grayplot(), Sgrayplot(),
plot3d(), contour(), etc.. travaillent
directement avec des grilles de coordonnées générées par ndgrid(),
non de meshgrid(). Les données calculées à partir d'une
grille issue de meshgrid() devront être transposées
(voir l'exemple ci-dessous). |
Exemples
[X, Y] = meshgrid(0:2)
--> [X, Y] = meshgrid(0:2)
 X  =
   0.   1.   2.
   0.   1.   2.
   0.   1.   2.

 Y  =
   0.   0.   0.
   1.   1.   1.
   2.   2.   2.
[X, Y] = meshgrid(["a" "bc" "αβγδ"], [-3 5])
--> [X, Y] = meshgrid(["a" "bc" "αβγδ"], [-3 5])
 X  =
!a  bc  αβγδ  !
!a  bc  αβγδ  !

 Y  =
  -3.  -3.  -3.
   5.   5.   5.
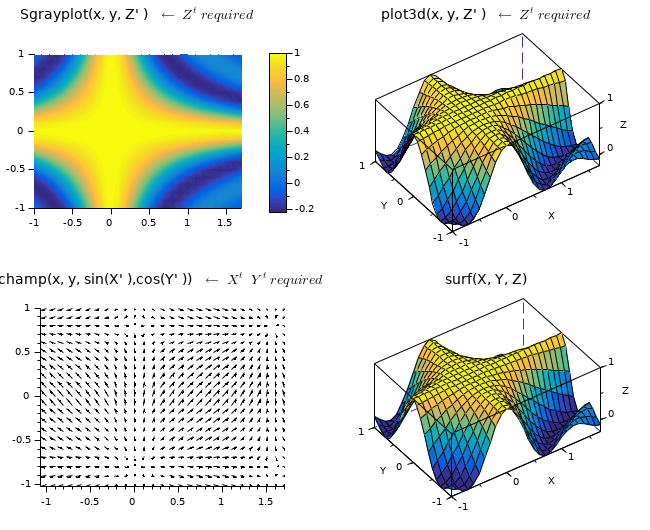
Application aux grilles graphiques :
// Production des données à illustrer
x = -1:0.1:1.7;
y = -1:0.1:1;
[X, Y] = meshgrid(x, y);
Z = sinc(2*%pi * X.*Y);

// Préparation de la fenêtre graphique
clf
drawlater
gcf().color_map = parulacolormap(64);
gcf().axes_size = [650 530];

// Affichage graphique
subplot(2,2,1)
Sgrayplot(x, y, Z')
title(["Sgrayplot(x, y, Z'' ) " "$←\;Z^t\; requis$"], "fontsize",3)
isoview, colorbar

subplot(2,2,2)
plot3d(x, y, Z', -125,50)
gce().color_flag = 1;
title(["plot3d(x, y, Z'' ) " "$←\;Z^t\; requis$"], "fontsize",3)
isoview

subplot(2,2,3)
champ(x,y,sin(2*X'),cos(2*Y'))
title(["champ(x, y, sin(X'' ),cos(Y'' ))" "$←\;X^t\;\;Y^t\; requis$"], "fontsize",3)
isoview

subplot(2,2,4)
surf(X, Y, Z)
title("surf(X, Y, Z)", "fontsize",3)
isoview

gcf().children.tight_limits = ["on" "on" "on"];
drawnow

Voir aussi
| Report an issue | ||
| << logspace | Matrice - génération | ndgrid >> |