Scilab 5.5.1
Please note that the recommended version of Scilab is 2026.1.0. This page might be outdated.
See the recommended documentation of this function
orthProj
点の平面上のポリラインへの直交射影を計算する
呼び出し手順
[d,ptp,ind,c] = orthProj(data,pt)
引数
- data
n 行 2 列配列. 最初の列にはポリラインのX座標, 2番目の列にはY座標を有します.
- pt
2個のエントリを有する配列: 点の座標
- d
指定した点とポリラインのデータ点の間の最小距離.
- ptp
2個のエントリを有する配列: 距離が最小となる点の座標
- ind
セグメント
[ind ind+1]で ポリラインに最も近い点となる>.- c
直交射影の補間係数.
説明
平面上のポリラインへの点の直交射影を計算します.
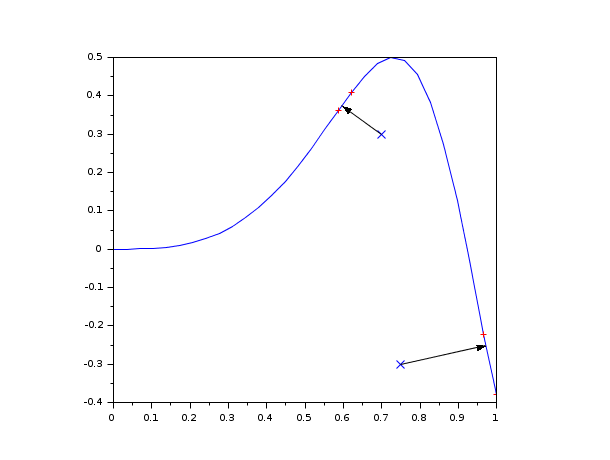
例
x=linspace(0,1,30)';

y=sin(4*x.^3)/2;

clf();a=gca();a.isoview='on';

plot(x,y)

pt=[0.7 0.3];

plot(pt(1),pt(2),'xb')

[d,ptp,ind,c]=orthProj([x y],pt);

plot(x(ind:ind+1),y(ind:ind+1),'+r')

xpoly([pt(1);ptp(1)],[pt(2);ptp(2)])

e=gce();e.polyline_style=4;e.arrow_size_factor = 1.5;

pt=[0.75 -0.3];

plot(pt(1),pt(2),'xb')

[d,ptp,ind,c]=orthProj([x y],pt);

plot(x(ind:ind+1),y(ind:ind+1),'+r')

xpoly([pt(1);ptp(1)],[pt(2);ptp(2)])

e=gce();e.polyline_style=4;e.arrow_size_factor = 1.5;
| Report an issue | ||
| << datatips | Datatips | figure_operations >> |