- Scilabヘルプ
- Graphics
- 2d_plot
- LineSpec
- Matplot
- Matplot1
- Matplot_properties
- Sfgrayplot
- Sgrayplot
- champ
- champ1
- champ_properties
- comet
- contour2d
- contour2di
- contourf
- errbar
- fchamp
- fcontour2d
- fec
- fec_properties
- fgrayplot
- fplot2d
- grayplot
- grayplot_properties
- graypolarplot
- histplot
- paramfplot2d
- plot
- plot2d
- plot2d1
- plot2d2
- plot2d3
- plot2d4
- polarplot
Please note that the recommended version of Scilab is 2026.1.0. This page might be outdated.
See the recommended documentation of this function
grayplot
曲面の2次元カラープロット
呼び出し手順
grayplot(x,y,z,[strf,rect,nax])

grayplot(x,y,z,<opt_args>)
引数
- x,y
大きさ n1 および n2の実数行ベクトル.
- z
大きさ (n1,n2)の実数行列.
z(i,j)は 点 (x(i),y(j))における曲面の値です.- <opt_args>
一連の命令
key1=value1,

                            key2=value2
,... を表します.ただし,key1,key2,...には以下のどれかを指定します: rect, nax, strf, logflag または axesflag および frameflag (plot2dおよび 参照).- strf,rect,nax
plot2d参照.
説明
grayplot は,
x および yで定義されるグリッド上で
zにより指定された曲面の2次元プロットを作成します.
グリッド上の各矩形は,矩形の4隅のzの値の平均値
に基づきモノクロまたはカラーで塗りつぶされます.
z に %nan 値が含まれる場合,周囲の矩形は表示されません.
コマンド grayplot() を入力するとデモが表示されます.
例
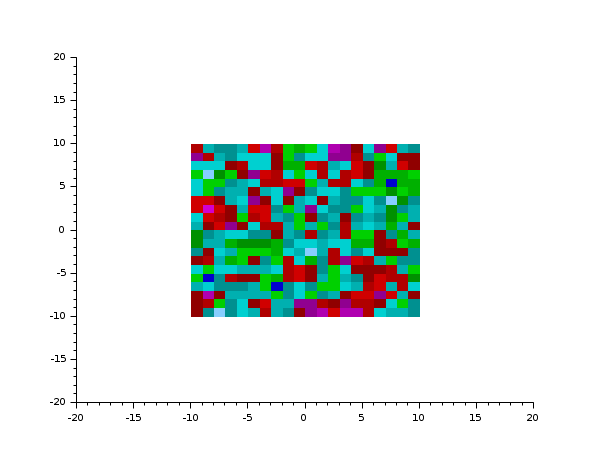
x=-10:10; y=-10:10;m =rand(21,21);

grayplot(x,y,m,rect=[-20,-20,20,20])

t=-%pi:0.1:%pi; m=sin(t)'*cos(t);

clf()

grayplot(t,t,m)
参照
- fgrayplot — 関数により定義される曲面のカラー二次元プロット
- plot2d — 2Dプロット
- Sgrayplot — 色付きの曲面の2次元平滑化プロット
- Sfgrayplot — 関数により定義された曲面の平滑化2次元カラープロット
履歴
| バージョン | 記述 |
| 5.5.0 | オプションlogflagが導入されました. |
| Report an issue | ||
| << fplot2d | 2d_plot | grayplot_properties >> |