- Scilabヘルプ
- Graphics
- 2d_plot
- LineSpec
- Matplot
- Matplot1
- Matplot_properties
- Sfgrayplot
- Sgrayplot
- champ
- champ1
- champ_properties
- comet
- contour2d
- contour2di
- contourf
- errbar
- fchamp
- fcontour2d
- fec
- fec_properties
- fgrayplot
- fplot2d
- grayplot
- grayplot_properties
- graypolarplot
- histplot
- paramfplot2d
- plot
- plot2d
- plot2d1
- plot2d2
- plot2d3
- plot2d4
- polarplot
Please note that the recommended version of Scilab is 2026.1.0. This page might be outdated.
See the recommended documentation of this function
champ
2次元ベクトルフィールドのプロット
呼び出し手順
champ(x,y,fx,fy,[arfact,rect,strf])

champ(x,y,fx,fy,<opt_args>)
引数
- x,y
グリッドを定義するベクトル.
- fx
ベクトルフィールドのx要素を記述する行列.
fx(i,j)は点(x(i),y(j))における ベクトルフィールドのx要素です.- fy
ベクトルフィールドのy要素を記述する行列.
fy(i,j)は点(x(i),y(j))における ベクトルフィールドのy要素です.- <opt_args>
一連の命令
key1=value1,key2=value2,... を表します. ただし,key1,key2,...には以下のどれかを指定可能です: arfact, rect, strf (以下参照).- arfact
実数型のオプションの引数で, プロット時の矢じりの表示用のスケールファクタを指定します. (デフォルト値は 1.0).
- rect
使用するグラフィックフレームの境界を指定する ベクトル
rect=[xmin,ymin,xmax,ymax].- strf
長さ3の文字列 "xyz" で,
plot2dのstrfパラメータと意味は同じです. 最初の文字xはchampでは意味がありません.
説明
champ は2次元ベクトルフィールドを描画します.
矢印の長さはフィールドのインテンシティに比例します.
フィールドのインテンシティに依存した色を有する色付の矢印を
使用したい場合,champ1を使用してください.
コマンド champ() を入力するとデモが表示されます.
champの使用前に meshgrid関数を
使用する場合は調整が必要なことに注意してください.
詳細については最後の例を参照ください.
例
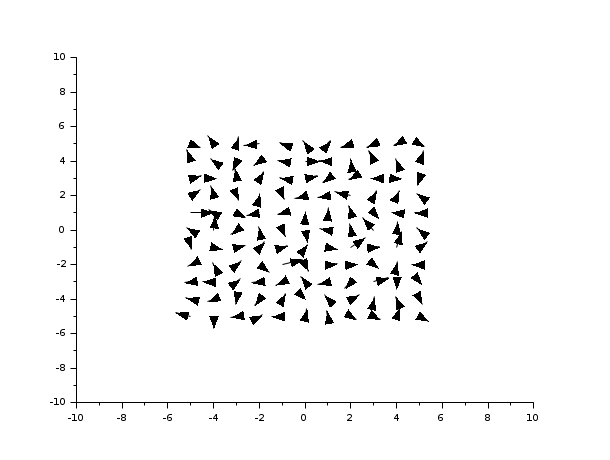
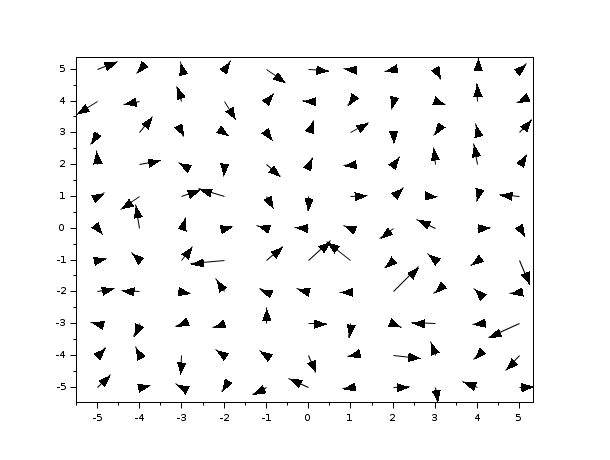
// fx および fy を得るために meshgrid を使用
clf()
x = linspace(-1,1,30);
y = linspace(-1,1,30);
[X,Y] = meshgrid(x,y);
fy = 2.*Y;
fx = 2.*X;
champ(x,y,fx',fy'); //転置した fx および fyを使用

| Report an issue | ||
| << Sgrayplot | 2d_plot | champ1 >> |