param3d
plots a single curve in a 3D cartesian frame
param3d1
plots a set of curves in a 3D cartesian frame. 1D mesh plot
Syntax
param3d(x, y, z)
param3d(x, y, z, [theta, alpha, leg, flag, ebox])
param3d // demo

param3d1(X, Y, Z)
param3d1(X, Y, list(Z, styles))
param3d1(.., [theta, alpha, leg, flag, ebox])
param3d1 // demo
Arguments
- x, y, z
3 vectors of the same length: cartesian coordinates of the curve's points.
- X, Y, Z
matrices of the same size (nl,nc). Each column #i of the matrices provides the coordinates of the points for the ith curve.
- styles
vector of nc=size(Z,"c") integers specifying the style -- line color or mark style -- of each curve. When it is specified, it must be bundled with
Zinto a list, usinglist(Z, styles).By default, lines are drawn with colors indexed from 1 to nc in the current color map, without mark.
If
styles(i)<0, the curve #i is plotted only with marks of style #|styles(i)|, without line.Otherwise (
styles(i)>0), the curve #i is rendered as a solid line of color #styles(i), without marks.- theta
Azimuth angle of the (OP) observation point, around the (OZ+) axis, in degrees. Default = 45°.
- alpha
Polar angle of the (OP) observation point to the north pole (Oz+), in degrees, from 0 to 180. Default = 35°.
- leg
single string setting the labels for the 3 axes. "@" is used as a labels separator. Default = "X@Y@Z"
- flag = [type, box]
typeandboxhave the same meaning as inplot3d:- type
Sets the axes scaling and bounding modes. Default = 2.
type gca().isoview data bounds 0 off [0,1, 0,1, -1,1] 1 off in ebox2 off from data points 3 on in ebox4 on from data points 5 on in ebox6 on from data points  Isometrical modes are rendered with
gca().cube_scaling="off".- box
an integer controlling the display of the axes frame (default = 4).
Value Displayed axes Axes legends gca().box gca().axes_visible 0 none. No frame. yes "off" "off" 1 not implemented. Like 0. Please use 0. 2 only axes lines on the back NO "hidden_axes" "off" 3 full ungraduated box yes "on" "off" 4 full box + 3 graduated axes yes "on" "on"
- ebox
Vector
[xmin,xmax, ymin,ymax, zmin,zmax]of axes bounds, used and assigned togca().data_boundswhen theflagoption is used with thetype=1|3|5. By default set to [0,1, 0,1, 0,1].
Description
param3d() is used to plot a single 3D curve defined by its coordinates
x, y and z.
The curve is an object of polyline type. When it is used just after
param3d(), gce() returns the curve's identifier,
from which all the curve's properties may be changed: color, line style, thickness,
mark style and colors, etc.
param3d1() is used to plot a set of 3D curves, all having the
same number of points. Then, gce().children
returns the vector of identifiers of the whole set of curves.
| The graphical identifier of the curve #i is gce().children($-i+1). |
Examples
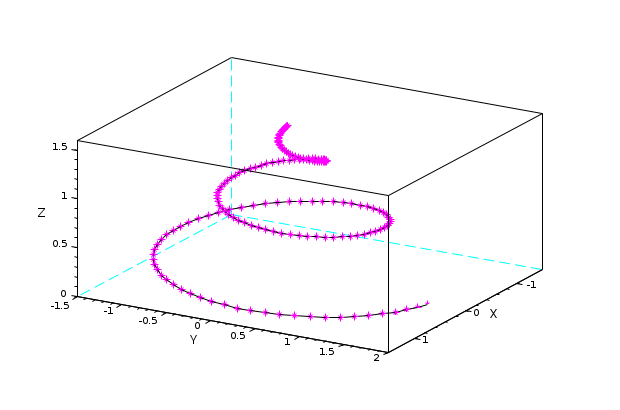
t = 0:0.1:5*%pi;
r = (max(t)-t)/10;

clf
param3d(r.*sin(t), r.*cos(t), t/10, 30, 72,"X@Y@Z",[4,4])

curve = gce();
curve.mark_mode = "on";
curve.mark_style = 10;
curve.mark_foreground = color("magenta");
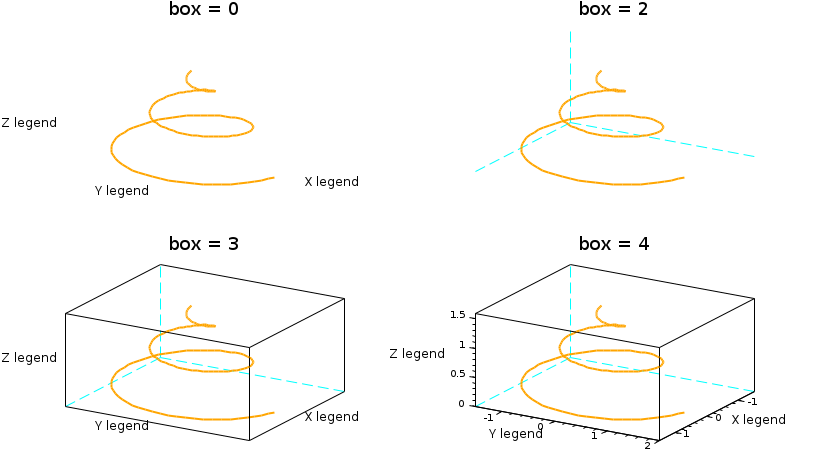
box parameter illustrated with param3d1() used for a single curve :
t = (0:0.1:5*%pi)';
r = (max(t)-t)/10;
x = r.*sin(t); y = r.*cos(t); z = list(t/10, color("orange"));
Box = [0 2 3 4];

clf
for i = 1:4
   subplot(2,2,i)
   param3d1(x, y, z, 31, 72,"X legend@Y legend@Z legend",[4, Box(i)])
   title(msprintf("box = %d",Box(i)), "fontsize", 4)
end
gcf().children.children.thickness = 2; // for the 4 curves in a once
gca().sub_ticks = [4 4 4];             // only for the last axes
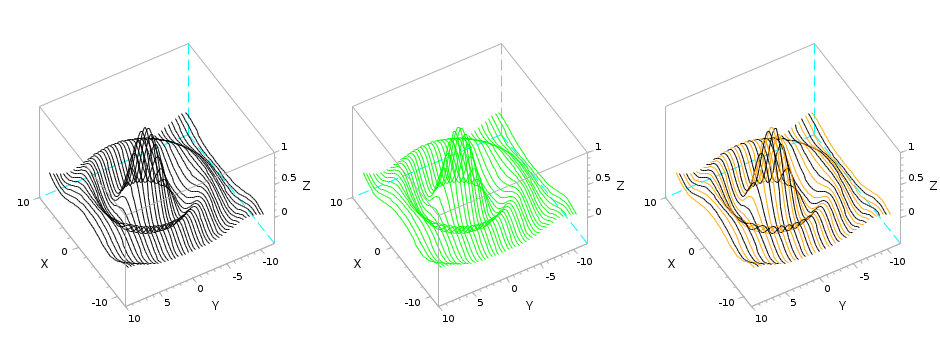
param3d1() used for an actual set of curves:
[X, Y] = ndgrid(-11:0.5:9);
R = sqrt(X.*X + Y.*Y) + %eps;
Z = sin(R)./R;

clf
subplot(1,3,1)
param3d1(X, Y, Z, 150, 85, flag=[2,4])

subplot(1,3,2)
param3d1(X, Y, Z, 150, 85, flag=[2,4])
gce().children.foreground = color("green");

subplot(1,3,3)
param3d1(X, Y, Z, 150, 85, flag=[2,4])
curves = gce().children;
curves(1:2:$).foreground = color("orange");
gca().box = "back_half";

gcf().children.foreground = color("grey70"); // box & ticks color for the 3 figures
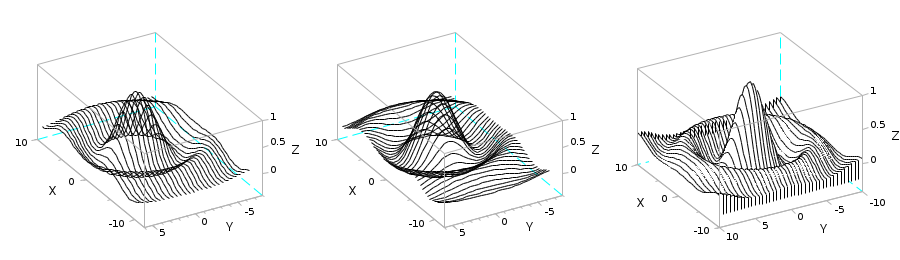
[X, Y] = ndgrid(-11:0.5:9, -7:0.5:6); // x is the long side, y the short one
// => X has constant rows. Y has constant columns

clf

// Meshing lines at constant Y values
subplot(1, 3, 1)
R = sqrt(X.*X + Y.*Y) + %eps;
Z = sin(R)./R;
param3d1(X, Y, Z, 150, 85, flag=[2,4])

// Meshing lines at constant X values, with transposed X and Y:
subplot(1, 3, 2)
R = sqrt(X'.*X' + Y'.*Y') + %eps;
Z = sin(R)./R;
param3d1(X', Y', Z, 150, 85, flag=[2,4])

// With a curtain and filled curves to avoid messed overlaying parts
subplot(1, 3, 3)
[Xo, Yo] = ndgrid(-10:0.5:10);
R = sqrt(Xo.*Xo + Yo.*Yo) + %eps;
Zo = sin(R)./R;
    // we add the curtain on starting and ending sides
nc = size(Xo,"c");
zmin = min(Zo);
X = [Xo(1,:) ; Xo ; Xo($,:)];
Y = [Yo(1,:) ; Yo ; Yo($,:)];
Z = [zmin*ones(1,nc) ; Zo ; zmin*ones(1,nc)];
    // Rendering
param3d1(X, Y, Z, 150, 85, flag=[2,4])
e = gce();
e.children.fill_mode = "on";

// grey box for all axes:
gcf().children.foreground = color("grey70");
See also
- plot3d — 3D plot of a surface
- plot3d3 — mesh plot surface defined by rectangular facets
- scatter 3D — 3D scatter plot
- axes_properties — description of the axes entity properties
- polyline_properties — description of the Polyline entity properties
| Report an issue | ||
| << nf3d | 3d_plot | param3d properties >> |