fgrayplot
2D plot of a surface defined by a function using colors
Syntax
fgrayplot(x,y,f,[strf,rect,nax])
fgrayplot(x,y,f,<opt_args>)
Arguments
- x,y
real row vectors.
- f
external of type
y=f(x,y).- <opt_args>
This represents a sequence of statements
key1=value1, key2=value2,... wherekey1,key2,...can be one of the following: rect, nax, strf or axesflag and frameflag (seeplot2d).- strf,rect,nax
see
plot2d.
Description
fgrayplot makes a 2D plot of the surface given by z=f(x,y) on a
grid defined by x and y.
Each rectangle on the grid is filled with a gray or color level depending
on the average value of z on the corners of the rectangle.
Enter the command fgrayplot() to see a demo.
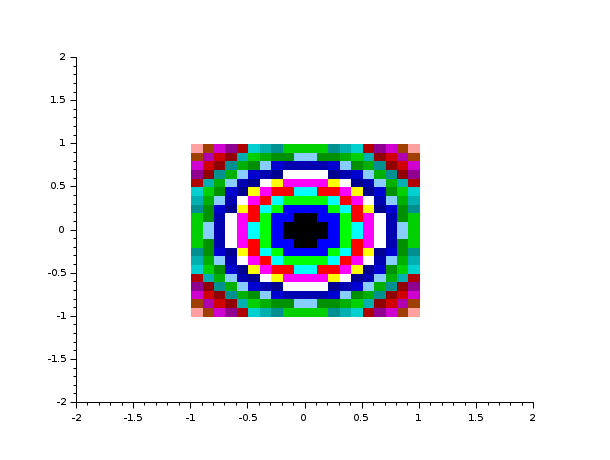
Examples
t=-1:0.1:1;
deff("[z]=my_surface(x,y)","z=x**2+y**2")
fgrayplot(t,t,my_surface,rect=[-2,-2,2,2])
See also
- grayplot — 2D plot of a surface using colors
- plot2d — 2D plot
- Sgrayplot — smooth 2D plot of a surface using colors
- Sfgrayplot — smooth 2D plot of a surface defined by a function using colors
| Report an issue | ||
| << fec properties | 2d_plot | grayplot >> |