errbar
add vertical error bars on a 2D plot
Syntax
errbar(x, y, em, ep)
Arguments
- x, y, em, ep
four matrices of the same size.
Description
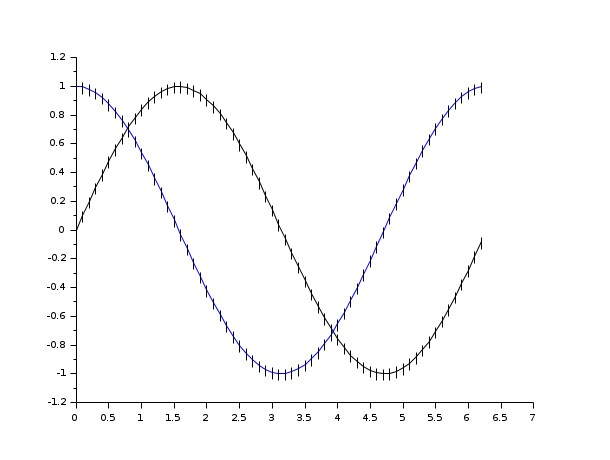
errbar adds vertical error bars on a 2D plot.
x and y have the same meaning
as in plot2d.
em(i,j) and ep(i,j) stands for
the error interval on the value y(i,j):
[y(i,j)-em(i,j),y(i,j)+ep(i,j)].
Enter the command errbar() to see a demo.
Examples
See also
- plot2d — 2D plot
| Report an issue | ||
| << cutaxes | 2d_plot | fchamp >> |