meshgrid
Create matrices or 3-D arrays from vectors replicated in 2 or 3 dimensions
Syntax
U = meshgrid(u)
[U, V] = meshgrid(u)
[X, Y] = meshgrid(x, y)
[X, Y, Z] = meshgrid(x, y, z)
Arguments
- u, x, y, z
Vectors of any types, of lengths nu, nx, ny, nz.
- U, V
Square matrices of size nu x nu
- X, Y, Z
Matrices or hypermatrices of the same size [ny, nx] or [ny, nx, nz].
Description
meshgrid(..) builds matrices or 3-D hypermatrices by replicating input vectors along 2 or 3 dimensions.
 | To create arrays of size [nx, ny] instead of
[ny, nx], or with more than 3 dimensions, please use
|
 | Most of Scilab 2D or 3D graphical functions like |
Examples
[X, Y] = meshgrid(0:2)
--> [X, Y] = meshgrid(0:2)
 X  =
   0.   1.   2.
   0.   1.   2.
   0.   1.   2.

 Y  =
   0.   0.   0.
   1.   1.   1.
   2.   2.   2.
[X, Y] = meshgrid(["a" "bc" "αβγδ"], [-3 5])
--> [X, Y] = meshgrid(["a" "bc" "αβγδ"], [-3 5])
 X  =
!a  bc  αβγδ  !
!a  bc  αβγδ  !

 Y  =
  -3.  -3.  -3.
   5.   5.   5.
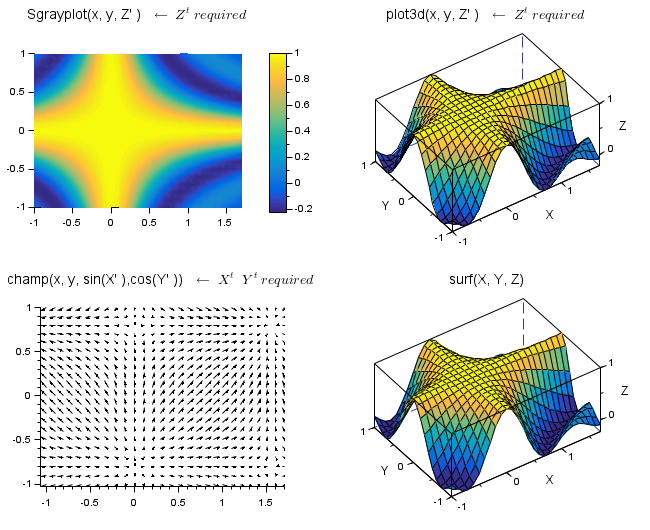
Application to grids for graphics:
// Generating data
x = -1:0.1:1.7;
y = -1:0.1:1;
[X, Y] = meshgrid(x, y);
Z = sinc(2*%pi * X.*Y);

// Setting the graphic figure
clf
drawlater
gcf().color_map = parula(64);
gcf().axes_size = [650 530];

// Plotting
subplot(2,2,1)
Sgrayplot(x, y, Z')
title(["Sgrayplot(x, y, Z'' ) " "$←\;Z^t\; required$"], "fontsize",3)
isoview, colorbar

subplot(2,2,2)
plot3d(x, y, Z', -125,50)
gce().color_flag = 1;
title(["plot3d(x, y, Z'' ) " "$←\;Z^t\; required$"], "fontsize",3)
isoview

subplot(2,2,3)
champ(x,y,sin(2*X'),cos(2*Y'))
title(["champ(x, y, sin(X'' ),cos(Y'' ))" "$←\;X^t\;\;Y^t\; required$"], "fontsize",3)
isoview

subplot(2,2,4)
surf(X, Y, Z)
title("surf(X, Y, Z)", "fontsize",3)
isoview

gcf().children.tight_limits = ["on" "on" "on"];
drawnow
See also
| Report an issue | ||
| << magic | Matrix generation | ndgrid >> |