Please note that the recommended version of Scilab is 2026.1.0. This page might be outdated.
See the recommended documentation of this function
sgrid
esboça linhas de grid de um s-plano
Seqüência de Chamamento
sgrid()
sgrid(zeta, wn)
sgrid(.., colors)
sgrid(.., "new")
Arguments
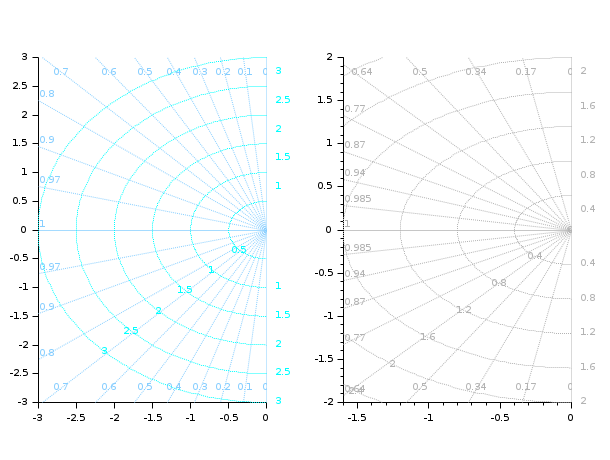
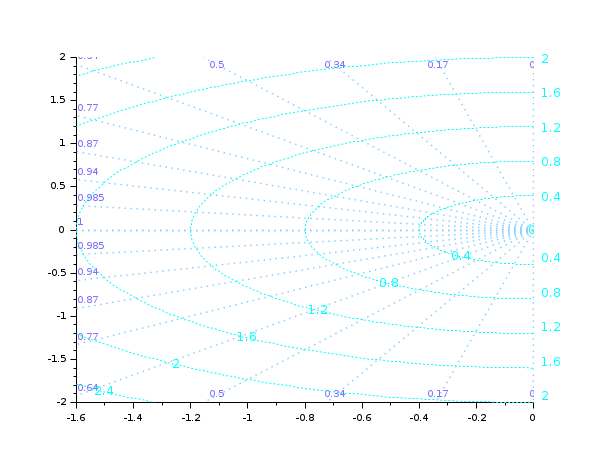
- zeta
vector of damping factors. Only values in
[0 1]are taken into account. The default values are ~ cosd(90:-10:0) =[0 0.17 0.34 0.5 0.64 0.77 0.87 0.94 0.985 1].- wn
array of natural frequencies in Hz. only positive values are taken into account. If not given it is computed by the program to fit with the boundaries of the plot.
- colors
a scalar or a vector with 2 elements [circles_col, rays_col], specifying the color(s) of circles and rays of the frame, and their labels: predefined colors names (like "red"), or colors hexadecimal codes (like "#34DDFA"), or colors indices in the current colormap are accepted.
- "new"
This option clears all contents of the current axes before plotting the grid. It may be specified at any position among input arguments.
Descrição
Usado em conjunto com evans, esboça linhas de taxa de amortecimento
constante (zeta) e freqüência natural
(wn).
- sgrid()
adiciona um grid sobre uma raiz do s-plano contínuo existente com valores padrões para
zetaewn.- sgrid(zeta,wn [,color])
é o mesmo que
sgrid()mas utiliza a taxa de amortecimento e a freqüência natural fornecidas.
Exemplos
Post-tuning graphical elements of the grid:
sgrid()

sGrid = gca().children.children.children;
i = find(sGrid(3:$).type=="Polyline" & sGrid(1:$-2).type=="Polyline",1);

Circles = sGrid(1:i-1);
Circ_text = Circles(Circles.type=="Text");      // Labels
Circ_text.font_size = 2;
Circ_lines = Circles(Circles.type=="Polyline"); // Circles
Circ_lines.line_style = 8;

Rays = sGrid(i:$);
Rays(Rays.type=="Text").font_foreground = color("light slate blue");
Rays_lines = Rays(Rays.type=="Polyline");
set(Rays_lines, "line_style", 9, "thickness", 1.5);
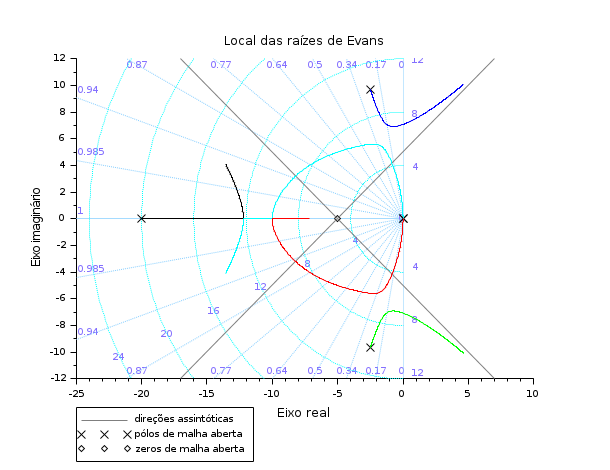
Evans plot + an s grid:
H = syslin('c',352*poly(-5,'s')/poly([0,0,2000,200,25,1],'s','c'));
clf
evans(H,100)
sgrid()

// All labels in violet
sGrid = gca().children.children.children;
sGrid(sGrid.type=="Text").font_foreground = color("light slate blue");
Ver Também
- evans — lugar geométrico das raízes Evans
- zgrid — esboçode um z-grid
- hallchart — Draws a Hall chart
- nicholschart — Nichols chart
Histórico
| Versão | Descrição |
| 6.0.2 | colors can be specified by their name or by their #RRGGBB code. |
| Report an issue | ||
| << routh_t | Stability | show_margins >> |