Please note that the recommended version of Scilab is 2026.0.1. This page might be outdated.
However, this page did not exist in the previous stable version.
hist3d
3次元ヒストグラム (obsolete)
呼び出し手順
hist3d(mtx,[theta,alpha,leg,flag,ebox])
hist3d(mtx,<opt_args>)
hist3d(list(mtx,x,y),[theta,alpha,leg,flag,ebox])
hist3d(list(mtx,x,y),<opt_args>)
引数
- mtx
大きさ (m,n) の行列で, ヒストグラム
mtx(i,j)=F(x(i),y(j))を定義します. ただし,xおよびyは0:mおよび0:nの範囲とします.- list(mtx,x,y)
mtxは大きさ(m,n)の行列で,ヒストグラム
mtx(i,j)=F(x(i),y(j))を定義します.xおよびyは, 大きさ (1,m+1) および (1,n+1)のベクトルです.- <opt_args>
一連の命令
key1=value1, key2=value2,...を定義します.ただし,key1,key2,...には以下のどれかを指定できます: theta, alpha,leg,flag,ebox. plot3dを参照ください.- theta,alpha,leg,flag,ebox
plot3dを参照くださ.
説明
 | Up to Scilab 6.0, hist3d() features are actually some
bar3d() ones. In Scilab 6.1.0, bar3d() is
introduced as a clone of hist3d(). From now on, please use
bar3d() in replacement of the former hist3d().
hist3d() will be redefined in Scilab 6.2.0 to actually support 3D
histogram features. |
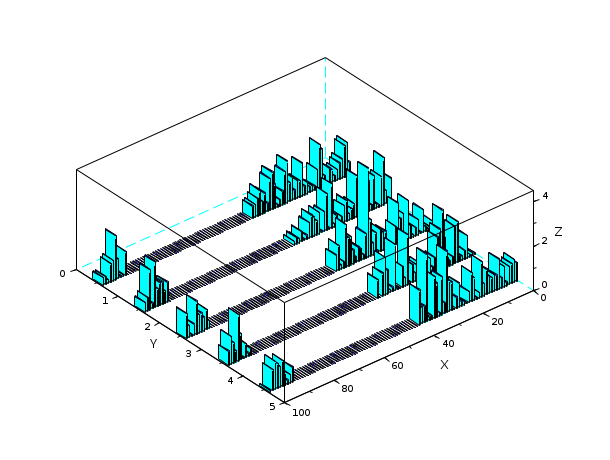
hist3d は2次元ヒストグラムを3次元プロットとして
表します.この値は,間隔[x(i) x(i+1)[ X [y(i)
y(i+1)[
に関連します.
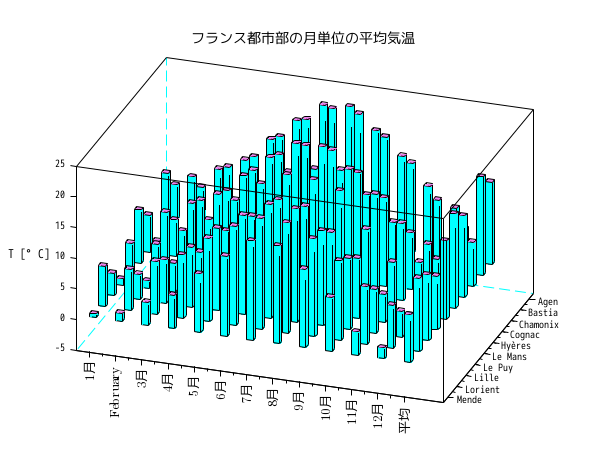
コマンド hist3d() を入力するとデモを参照できます.
例
hist3d();
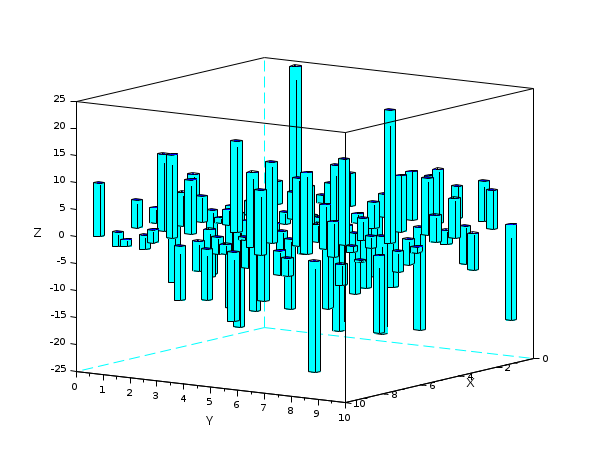
hist3d(grand(10, 10, "nor", 0, 10))
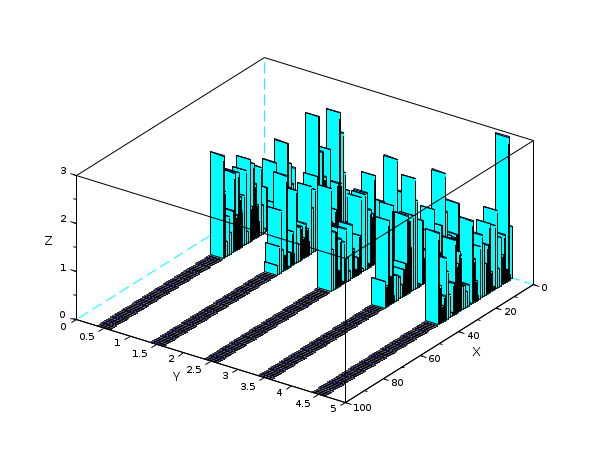
Z = zeros(100,5);
A = abs(rand(40,5));
Z(1:40,:) = A;
Index = find(Z==0);
Z(Index) = %nan;
scf();
hist3d(Z);
isoview off
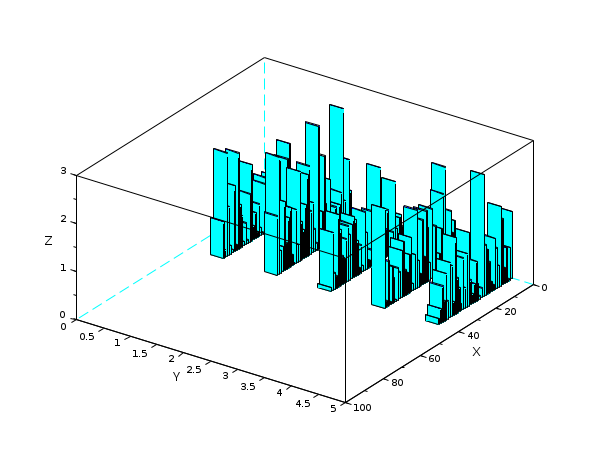
Z = zeros(100,5);
A = abs(rand(40,5));
Z(1:40,:) = A;
A = abs(rand(10,5));
Z(91:100,:) = A;
scf();
hist3d(Z);
isoview off
履歴
| バージョン | 記述 |
| 6.1.0 | The current implementation of hist3d() is declared obsolete. Use bar3d() instead. |
| Report an issue | ||
| << geom3d | 3d_plot | mesh >> |