Please note that the recommended version of Scilab is 2026.1.0. This page might be outdated.
However, this page did not exist in the previous stable version.
hist3d
трёхмерное представление гистограммы (obsolete)
Синтаксис
hist3d(mtx, [theta, alpha, leg, flag, ebox])
hist3d(mtx, <opt_args>)
hist3d(list(mtx,x,y), [theta, alpha, leg, flag, ebox])
hist3d(list(mtx,x,y), <opt_args>)
Аргументы
- mtx
матрица размером
(m,n), определяющая гистограммуmtx(i,j)=F(x(i),y(j)), гдеxиyвзяты в виде0:mи0:n.- list(mtx,x,y)
где
mtx- это матрица размером(m,n), определяющая гистограммуmtx(i,j)=F(x(i),y(j)), гдеxиy- это векторы размерами(1,m+1)и(1,n+1).- <opt_args>
это представляет последовательность деклараций
key1=value1,key2=value2,... гдеkey1,key2,... могут иметь одно из следующих значений:theta,alpha,leg,flag,ebox. См. plot3d.- theta, alpha, leg, flag, ebox
см. plot3d.
Описание
 | Up to Scilab 6.0, hist3d() features are actually some
bar3d() ones. In Scilab 6.1.0, bar3d() is
introduced as a clone of hist3d(). From now on, please use
bar3d() in replacement of the former hist3d().
hist3d() will be redefined in Scilab 6.2.0 to actually support 3D
histogram features. |
hist3d представляет двумерную гистограмму в виде трёхмерного графика.
Значения объединяются в полузакрытые интервалы [x(i),x(i+1)[ × [y(i),y(i+1)[.
Введите команду hist3d(), чтобы посмотреть демонстрацию.
Примеры
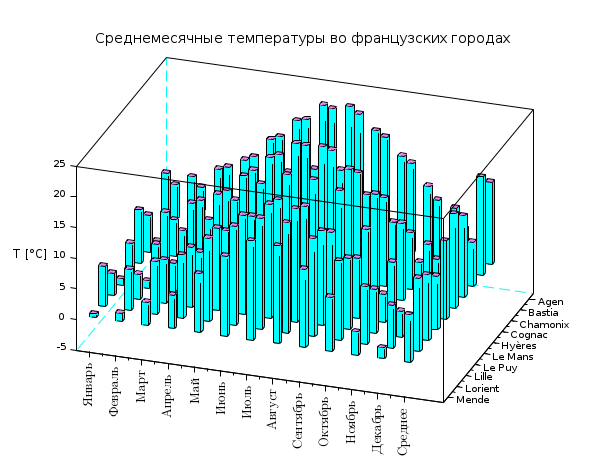
hist3d()
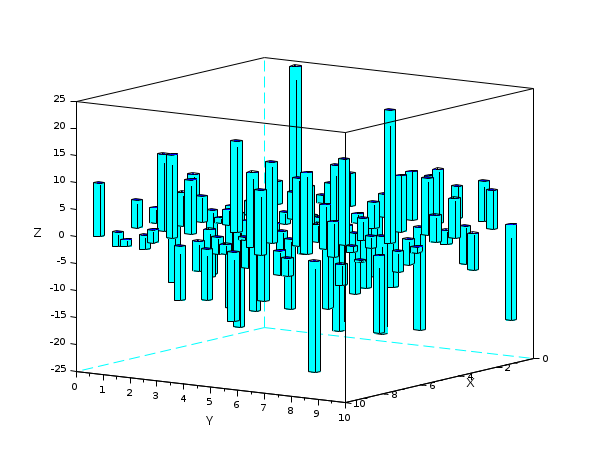
hist3d(grand(10, 10, "nor", 0, 10))

Z = zeros(100,5);
A = abs(rand(40,5));
Z(1:40,:) = A;
Index = find(Z==0);
Z(Index) = %nan;

clf
hist3d(Z)
isoview off
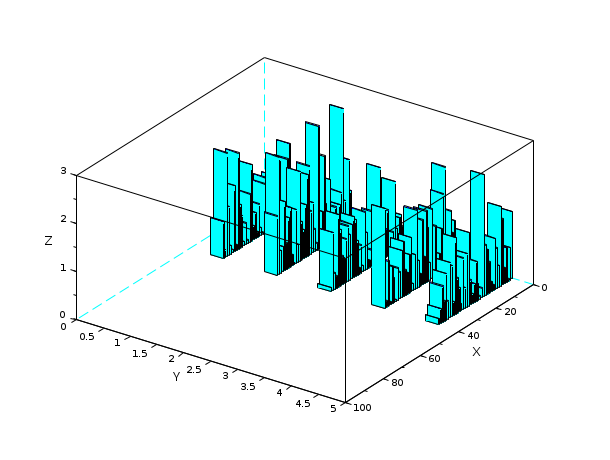
Z = zeros(100,5);
A = abs(rand(40,5));
Z(1:40,:) = A;
A = abs(rand(10,5));
Z(91:100,:) = A;

clf
hist3d(Z)
isoview off

История
| Версия | Описание |
| 6.1.0 | The current implementation of hist3d() is declared obsolete. Use bar3d() instead. |
| Report an issue | ||
| << geom3d | 3d_plot | mesh >> |