Scilab-Branch-6.1-GIT
- Aide de Scilab
- Graphiques
- 2d_plot
- champ
- champ1
- champ properties
- comet
- contour2d
- contour2di
- contour2dm
- contourf
- cutaxes
- errbar
- fchamp
- fec
- fec properties
- fgrayplot
- fplot2d
- grayplot
- grayplot properties
- graypolarplot
- histplot
- LineSpec
- loglog
- Matplot
- Matplot1
- Matplot properties
- paramfplot2d
- plot
- plot2d
- plot2d2
- plot2d3
- plot2d4
- plotimplicit
- polarplot
- scatter
- semilogx
- semilogy
- Sfgrayplot
- Sgrayplot
Please note that the recommended version of Scilab is 2026.0.1. This page might be outdated.
See the recommended documentation of this function
errbar
ajoute des barres d'erreur sur un dessin 2D
Séquence d'appel
errbar(x,y,em,ep)
Paramètres
- x,y,em,ep
4 matrices de même taille.
Description
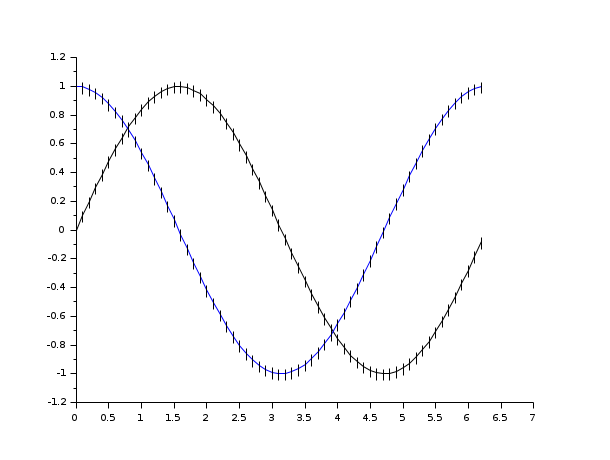
errbar ajoute des barres d'erreur sur un dessin 2D.
x et y ont la même signification que dans plot2d.
em(i,j) et ep(i,j) représentent l'intervalle d'erreur autour de la valeur
y(i,j) : [y(i,j)-em(i,j),y(i,j)+ep(i,j)].
Taper errbar() pour voir une démonstration de la fonction.
Exemples

Voir aussi
- plot2d — 2D plot
| Report an issue | ||
| << cutaxes | 2d_plot | fchamp >> |