Scilab-Branch-6.1-GIT
- Scilab Help
- Graphics
- 2d_plot
- LineSpec
- Matplot
- Matplot1
- Matplot properties
- Sfgrayplot
- Sgrayplot
- champ
- champ1
- champ properties
- comet
- contour2d
- contour2di
- contour2dm
- contourf
- cutaxes
- errbar
- fchamp
- fec
- fec properties
- fgrayplot
- fplot2d
- grayplot
- grayplot properties
- graypolarplot
- histplot
- loglog
- paramfplot2d
- plot
- plot2d
- plot2d2
- plot2d3
- plot2d4
- plotimplicit
- polarplot
- scatter
- semilogx
- semilogy
Please note that the recommended version of Scilab is 2026.1.0. This page might be outdated.
See the recommended documentation of this function
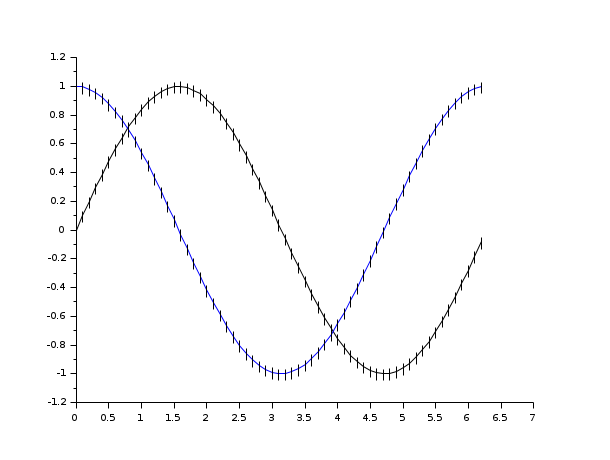
errbar
add vertical error bars on a 2D plot
Syntax
errbar(x, y, em, ep)
Arguments
- x, y, em, ep
four matrices of the same size.
Description
errbar adds vertical error bars on a 2D plot.
x and y have the same meaning
as in plot2d.
em(i,j) and ep(i,j) stands for
the error interval on the value y(i,j):
[y(i,j)-em(i,j),y(i,j)+ep(i,j)].
Enter the command errbar() to see a demo.
Examples
See also
- plot2d — 2D plot
| Report an issue | ||
| << cutaxes | 2d_plot | fchamp >> |