- Scilab Help
- Graphics
- 2d_plot
- LineSpec
- Matplot
- Matplot1
- Matplot properties
- Sfgrayplot
- Sgrayplot
- champ
- champ1
- champ properties
- comet
- contour2d
- contour2di
- contour2dm
- contourf
- cutaxes
- errbar
- fchamp
- fec
- fec properties
- fgrayplot
- fplot2d
- grayplot
- grayplot properties
- graypolarplot
- histplot
- loglog
- paramfplot2d
- plot
- plot2d
- plot2d2
- plot2d3
- plot2d4
- plotimplicit
- polarplot
- scatter
- semilogx
- semilogy
Please note that the recommended version of Scilab is 2026.1.0. This page might be outdated.
See the recommended documentation of this function
champ
plots as arrows a field of 2D vectors
Syntax
champ()  // example
champ(x, y, fx, fy)
champ(x, y, fx, fy, arfact)
champ(x, y, fx, fy, arfact, rect)
champ(x, y, fx, fy, arfact, rect, strf)
champ(x, y, fx, fy, <opt_args>)
Arguments
- x, y
vectors of decimal numbers, which define the grid of nodes = coordinates of arrows starting points.
- fx
a matrix which describes the x component of the vector field.
fx(i,j)is the x component of the vector field at point(x(i),y(j)).- fy
a matrix which describes the y component of the vector field.
fy(i,j)is the y component of the vector field at point(x(i),y(j)).- <opt_args>
This represents a sequence of statements
key1=value1, key2=value2,... wherekey1,key2,... can be one of the following:arfact,rect,strf(see below).- arfact
an optional argument of type
realwhich gives a scale factor for the display of the arrow heads on the plot (default value is1.0).- rect
a vector
rect=[xmin, ymin, xmax, ymax]which gives the boundaries of the graphics frame to use.- strf
a string of length 3 "xyz" which has the same meaning as the
strfparameter ofplot2d. The first characterxhas no effect withchamp.
Description
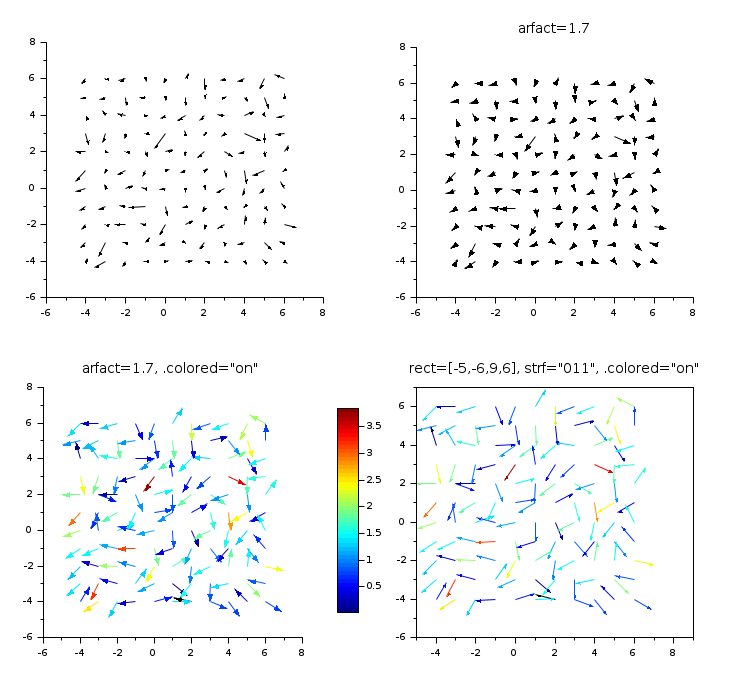
champ(…) plots a field of 2D vectors with arrows.
By default, all arrows have the same color, and their length is proportional to the local intensity of the field (norm of vectors). In addition, all lengths are normalized according to the longest arrow.
When setting gce().colored = "on",
each arrow becomes as long as possible in its cell, and is colored
according to the local intensity of the field.
After calling champ(…), gce()
returns the handle of the field of arrows, of type Champ,
whose properties can be post-processed.
Enter the command champ() to see an example.
Examples
x = -4:6;
X = ndgrid(x);
[fx, fy] =  (rand(X)-0.5, rand(X)-0.5);

clf
gcf().color_map = jetcolormap(50);

// Field's intensity = arrows length
subplot(2,2,1)
champ(x, x, fx, fy)

// With bigger arrow heads
subplot(2,2,2)
champ(x, x, fx, fy, arfact=1.7)
title("arfact=1.7", "fontsize",3)

// Field's intensity = arrows color
xsetech([0 0.5 0.55 0.5])
champ(x, x, fx, fy, arfact=1.7)
gce().colored = "on";
title("arfact=1.7, .colored=""on""", "fontsize",3)
colorbar

// Field's intensity = color, + imposed boundaries
subplot(2,2,4)
champ(x, x, fx, fy, rect=[-5,-6,9,7],strf="011")
gce().colored = "on";
title("rect=[-5,-6,9,6], strf=""011"", .colored=""on""", "fontsize",3)

gcf().axes_size = [740 680];
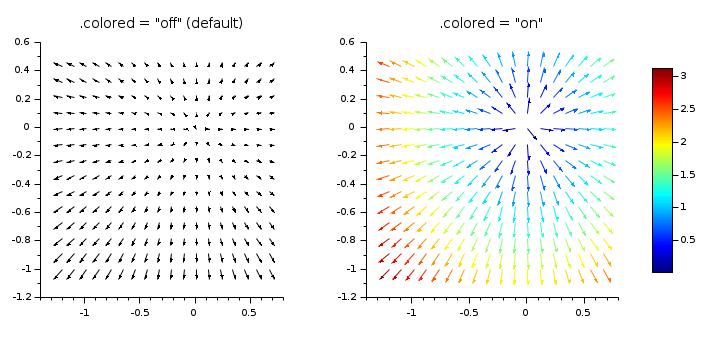
x = -1.2:0.11:0.7;
y = -1:0.11:0.5;
[X, Y] = ndgrid(x, y);
[fx, fy] = (2*X, 2*Y);

clf
xsetech([0 0 0.45 1])
champ(x, y, fx, fy)
title(".colored = ""off"" (default)", "fontsize",3)
xsetech([0.45 0 0.55 1])
champ(x, y, fx, fy)
title(".colored = ""on""", "fontsize",3)
gce().colored = "on";

gcf().color_map = jetcolormap(100);
colorbar
See also
- champ_properties — description of the 2D vector field entity properties
- fchamp — direction field of a 2D first order ODE
- xarrows — draw a set of arrows in 2D or in 3D.
- Arrowed polyline — description of the Polyline entity properties
| Report an issue | ||
| << Sgrayplot | 2d_plot | champ1 >> |