- Scilabヘルプ
- Graphics
- 2d_plot
- champ
- champ1
- champ_properties
- comet
- contour2d
- contour2di
- contour2dm
- contourf
- errbar
- fchamp
- fec
- fec_properties
- fgrayplot
- fplot2d
- grayplot
- grayplot_properties
- graypolarplot
- histplot
- LineSpec
- Matplot
- Matplot1
- Matplot_properties
- paramfplot2d
- plot
- plot2d
- plot2d2
- plot2d3
- plot2d4
- plotimplicit
- polarplot
- scatter
- Sfgrayplot
- Sgrayplot
Please note that the recommended version of Scilab is 2026.1.0. This page might be outdated.
However, this page did not exist in the previous stable version.
champ1
色付の矢印を有する2次元ベクトルフィールドのプロット (obsolete)
呼び出し手順
champ1(x, y, fx, fy, [arfact, rect, strf])
引数
- x,y
グリッドを定義するベクトル.
- fx
ベクトルフィールドのx要素を記述する行列.
fx(i,j)は点(x(i),y(j))における ベクトルフィールドのx要素です.- fy
ベクトルフィールドのy要素を記述する行列.
fy(i,j)は点(x(i),y(j))における ベクトルフィールドのy要素です.- arfact
実数型のオプションの引数で, プロット時の矢じりの表示用のスケールファクタを指定します. (デフォルト値は 1.0).
- rect
使用するグラフィックフレームの境界を指定する ベクトル
rect=[xmin,ymin,xmax,ymax].- frameflag
指定された値に関する最小限の範囲に基づく実際の座標系の範囲の計算を 制御します. 値として 0 から 8 の範囲の整数を指定します.
- axesflag
軸の描画方法を指定します. 0から5の範囲の整数を指定します.
- strf
長さ3の文字列 "xyz" で,
plot2dのstrfパラメータと意味は同じです. 最初の文字xはchamp1では意味がありません.
説明
 | champ1() is obsolete and will be removed from Scilab 6.1.x.
Please use the champ().colored property instead. |
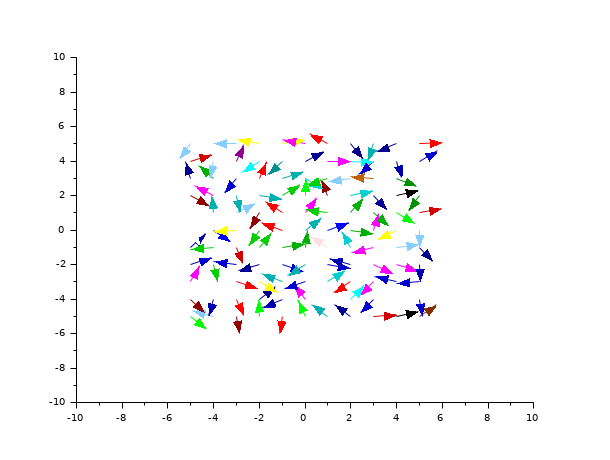
champ1 は色付の矢印を有する2次元ベクトルフィールドを描画します.
矢印の色はフィールドのインテンシティに依存します.
矢印の長さをフィールドのインテンシティに比例させたい場合,
champを使用してください.
コマンド champ1()を入力するとデモが表示されます.
champ1の使用前に meshgrid関数を
使用する場合は調整が必要なことに注意してください.
詳細については最後の例を参照ください.
例
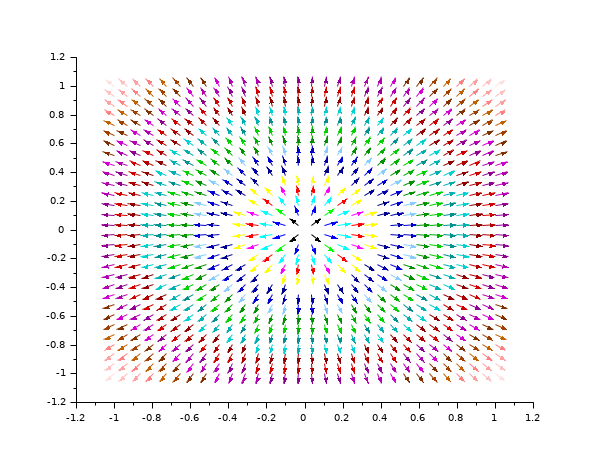
// fx および fy を取得するために meshgrid を使用

clf()

x = linspace(-1,1,30);

y = linspace(-1,1,30);

[X,Y] = meshgrid(x,y);

fy = 2.*Y;

fx = 2.*X;

champ1(x,y,fx',fy'); //転置したfxおよびfyを使用
履歴
| Version | Description |
| 6.1.0 | champ1() is declared obsolete. The champ().colored property replaces it. |
| Report an issue | ||
| << champ | 2d_plot | champ_properties >> |