Scilab 6.1.0
- Scilabヘルプ
- Graphics
- 2d_plot
- champ
- champ1
- champ_properties
- comet
- contour2d
- contour2di
- contour2dm
- contourf
- errbar
- fchamp
- fec
- fec_properties
- fgrayplot
- fplot2d
- grayplot
- grayplot_properties
- graypolarplot
- histplot
- LineSpec
- Matplot
- Matplot1
- Matplot_properties
- paramfplot2d
- plot
- plot2d
- plot2d2
- plot2d3
- plot2d4
- plotimplicit
- polarplot
- scatter
- Sfgrayplot
- Sgrayplot
Please note that the recommended version of Scilab is 2026.0.1. This page might be outdated.
See the recommended documentation of this function
comet
2次元 comet アニメーションプロット
呼び出し手順
comet(y)
comet(x, y)
comet(x, y, Lf)
comet(x, fun)
comet(x, fun, Lf)
comet(..., "colors",c)
パラメータ
- x
- 実数ベクトルまたは行列. 省略された場合,
ベクトル
1:npが指定されたと仮定されます. ただし,npは曲線の点の数(下記参照)です. 行列として、各列は別々の彗星の軌跡の水平座標を定義します。 - y
- 長さの実数ベクトルまたは行列. 行列として、各列は別々の彗星の軌跡の縦座標を定義します。
nc=size(y,"c")は、同時に描画される彗星の数です。 - Lf
- 範囲
[0 1[の実数スカラー. デフォルト値は 0.1です. これは、彗星の痕跡のLeading fractionを定義します。最近の点は太い線でプロットされています (k=Lf*np)。 - fun
- 呼び出し手順
y=fun(x)のScilab関数.funは多項式または有理数とすることもできます. - c
nccolors of thenccomets traces. They may be specified as a vector ofnccolor indices or color names or "#RRGGBB" hexadecimal color codes. Or by a matrix (ncx3) of[r,g,b]vectors of Red-Green-Blue intensities in the [0,1] interval.
説明
(x,y) が同じ要素数のベクトルの場合,
この関数は,
mを1 から
np=length(x)まで変えて
曲線(x(1:m), y(1:m))の漸進を示す
2次元アニメーションプロットを描画します.
このプロットは以下の3つの部分から構成されます:
| ヘッド | カレントの位置(x(i),y(i))を示すマーカ. |
| ボディ | 軌跡の最も最近の点であるk=round(Lf*np)
で構成され、トレースのより厚い部分として表示されます。 |
| テール | 曲線の(x(1:i-k),y(1:i-k))の部分を表示. |
comet(x,fun,...) は, comet(x,feval(x,fun),...)
と等価です.
x および y は
同じ大きさの行列の場合, 各組 (x(:,l),y(:,l)) 毎に.
アニメーション表示された曲線が描画されます.
この場合, npは
xおよび yの 行の数です.
comet(...,"colors",c) は各曲線の色を設定する際に使用できます.
例
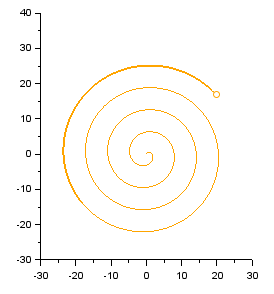
// One comet in spiral:
t = linspace(0, 10*%pi, 500);
clf, isoview
comet(t.*sin(t), t.*cos(t), "colors", "orange")

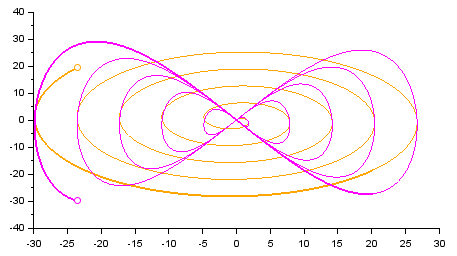
// Two simultaneous comets with default colors:
t = linspace(0,10*%pi,500)';
clf
comet(t.*sin(t), [t.*sin(2*t) t.*sin(3*t)])

履歴
| Version | Description |
| 5.3.2 | 関数 comet() が導入されました. |
| 6.1.0 | 色は、名前、"#RRGGBB"の16進コード、または赤緑青の強度で指定することもできるようになりました。 |
| Report an issue | ||
| << champ_properties | 2d_plot | contour2d >> |