Scilab 6.1.0
- Scilabヘルプ
- Graphics
- 2d_plot
- champ
- champ1
- champ_properties
- comet
- contour2d
- contour2di
- contour2dm
- contourf
- errbar
- fchamp
- fec
- fec_properties
- fgrayplot
- fplot2d
- grayplot
- grayplot_properties
- graypolarplot
- histplot
- LineSpec
- Matplot
- Matplot1
- Matplot_properties
- paramfplot2d
- plot
- plot2d
- plot2d2
- plot2d3
- plot2d4
- plotimplicit
- polarplot
- scatter
- Sfgrayplot
- Sgrayplot
Please note that the recommended version of Scilab is 2026.1.0. This page might be outdated.
See the recommended documentation of this function
Matplot1
行列の2次元カラープロット
呼び出し手順
Matplot1(a,rect)
引数
- a
大きさ
(n1,n2)の実数行列.- rect
[xmin,ymin,xmax,ymax]
説明
行列 int(a) のエントリは,カレントのカラーマップの
カラーマップエントリとして使用されます.
rectは,カレントのスケールで矩形を指定します.
行列はこの矩形の中に描画されます.
各行列のエントリはその色で塗られた小さな矩形として描画されます.
ある行列のエントリがカラーマップの外側の場合,
対応する矩形は表示されません.
コマンド Matplot1() を入力すると, デモが表示されます.
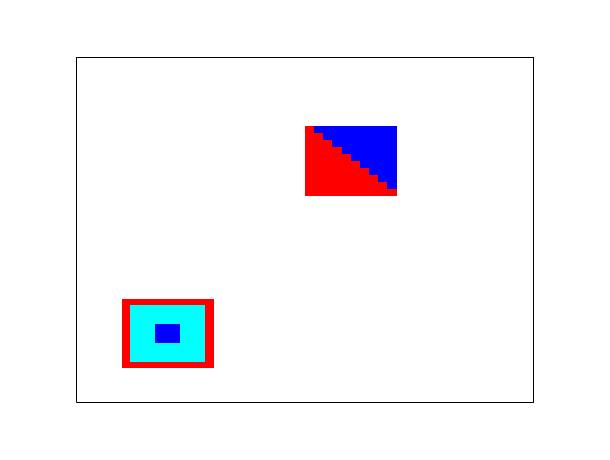
例
clf();

ax=gca();//カレントの軸のハンドルを取得

ax.data_bounds=[0,0;10,10];//data_boundsを設定

ax.box='on'; //ボックスを描画

a=5*ones(11,11); a(2:10,2:10)=4; a(5:7,5:7)=2;

// 矩形 [1,1,3,3]に最初の行列をプロット

Matplot1(a,[1,1,3,3])

a=ones(10,10); a= 3*tril(a)+ 2*a;

// 矩形 [5,6,7,8]に二番目の行列をプロット

Matplot1(a,[5,6,7,8])
//--- アニメーション)

n=100;

clf();

f = gcf();//カレントの図のハンドルを取得

ax = gca();//カレントの軸のハンドルを取得

ax.data_bounds = [0, 0 ; 10, 10];//data_boundsを設定

ax.box = 'on'; //ボックスを描画

o = ones(n, n);

a = 3 * tril(o, -n) + 2*o;

a = a + a';

Matplot1(a, [0, 2, 7, 9])

mp = gce();

for k = (-n + 1):n,

  a = 3 * tril(o, k) + 2 * o;

  a = a + a';

  k1 = 3 * (k + 100) / 200;

  mp.data = a;

  mp.rect = [k1, 2, k1 + 7, 9];

  sleep(8); // シミュレーションをスローダウン

end
参照
- colormap — カラーマップを定義
- plot2d — 2Dプロット
- Matplot — 行列のカラー二次元プロット
- grayplot — 曲面の2次元カラープロット
- Matplot_properties — Matplotエンティティプロパティの説明
| Report an issue | ||
| << Matplot | 2d_plot | Matplot_properties >> |