Scilab 6.1.0
- Aide de Scilab
- Graphiques
- 2d_plot
- champ
- champ1
- champ properties
- comet
- contour2d
- contour2di
- contour2dm
- contourf
- errbar
- fchamp
- fec
- fec properties
- fgrayplot
- fplot2d
- grayplot
- grayplot properties
- graypolarplot
- histplot
- LineSpec
- Matplot
- Matplot1
- Matplot properties
- paramfplot2d
- plot
- plot2d
- plot2d2
- plot2d3
- plot2d4
- plotimplicit
- polarplot
- scatter
- Sfgrayplot
- Sgrayplot
Please note that the recommended version of Scilab is 2026.1.0. This page might be outdated.
See the recommended documentation of this function
plot2d4
2D plot (arrows style)
Syntax
plot2d4([logflag,] x,y,[style,strf,leg,rect,nax])
plot2d4(y)
plot2d4(x,y <,opt_args>)
Arguments
- args
see
plot2dfor a description of parameters.
Description
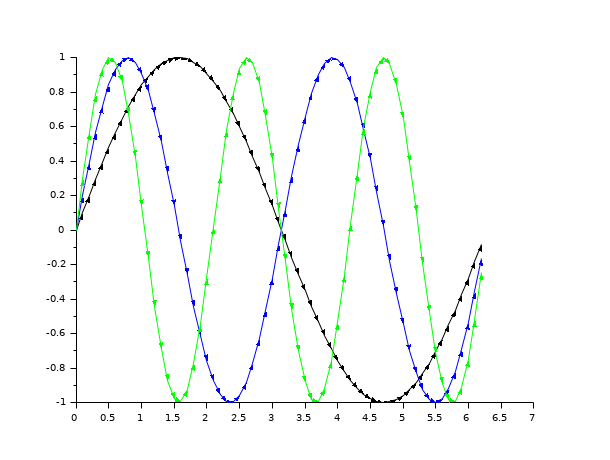
plot2d4 is the same as plot2d but curves are
plotted using arrows style. This can be useful when plotting solutions of
an ODE in a phase space.
By default, successive plots are superposed. To clear the previous
plot, use clf().
Enter the command plot2d4() to see a demo.
 | Note that all
the modes proposed by plot2dxx (xx = 1 to 4) can be enabled
using plot2d and setting the polyline_style
option to the corresponding number. |
Examples
Demo: plot2d4();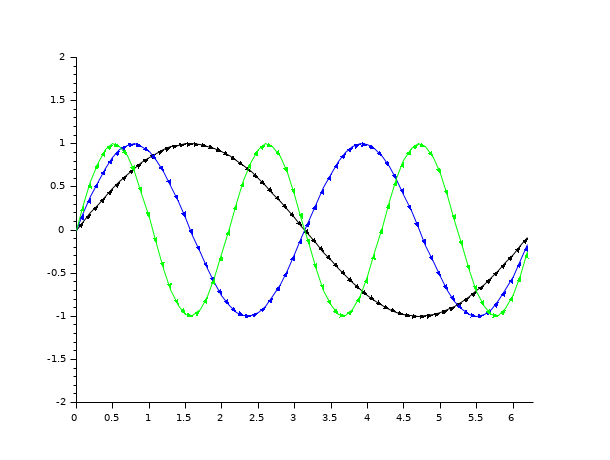 Examples:
// compare the following with plot2d + .polyline_style=4
clf
subplot(2,1,1)
x = [0:0.1:2*%pi]';
plot2d4(x,[sin(x) sin(2*x) sin(3*x)])

subplot(2,1,2)
plot2d(x,[sin(x) sin(2*x) sin(3*x)])
e = gce();
e.children.polyline_style=4;
See also
- fchamp — direction field of a 2D first order ODE
- plot2d — 2D plot
- plot2d2 — 2D plot (step function)
- plot2d3 — 2D plot (vertical bars)
- subplot — fixe le repère graphique actif dans une case choisie de la figure courante quadrillée
- clf — Clears and resets a figure or a frame uicontrol
- polyline_properties — description of the Polyline entity properties
| Report an issue | ||
| << plot2d3 | 2d_plot | plotimplicit >> |