Please note that the recommended version of Scilab is 2026.1.0. This page might be outdated.
See the recommended documentation of this function
Rendu d'équations mathématiques dans le graphique Scilab
Affiche les équations mathématiques dans le graphique Scilab grâce à MathML ou LaTeX.
Usage
A partir de Scilab 5.2, Il est possible d'écrire dans le graphique Scilab des équations LaTeX ou MathML.
Les expressions LaTeX doivent commencer par $ et se terminer $ (le caractère dollar), tandis que les expressions MathML doivent commencer par < et se terminer par > avec une syntaxe valide.
A la première utilisation (les bibliothèques sont chargées à la volée uniquement quand nécessaire), le moteur MathML est plus lent à charger que celui LaTeX.
// Example with LaTeX / MathML ticks:
plot2d();
a=gca();

mathml="<mrow><mfrac><mrow><mi>d</mi><mi>y</mi></mrow><mrow><mi>d</mi><mi>x</mi></mrow></mfrac><mo>=</mo><mfrac>" + ..
"<mn>1</mn><msup><mi>y</mi><mn>2</mn></msup></mfrac></mrow>";
// LaTeX and MathML mixed expression
a.x_ticks = tlist(["ticks", "locations", "labels"], (0:6)', [mathml;"1";"$\sin(x)$";"3";"$\cos(a) - test$";"5";"6"]);
Description LaTeX
Le rendu est basé sur la bibliothèque Java JLaTeXMath. Il s'agit d'une implémentation du mode mathématique de LaTeX. L'ensemble des commandes LaTeX de base sont gérées (s'il en manque une, n'hésitez pas à soumettre un rapport de bug), par contre celles de TeX, comme \over ne le sont pas.
Depuis Scilab 5.2.1, le grec, le cyrillique et l'intégralité de l'unicode pour les alphabets latin sont gérés dans les graphiques Scilab.
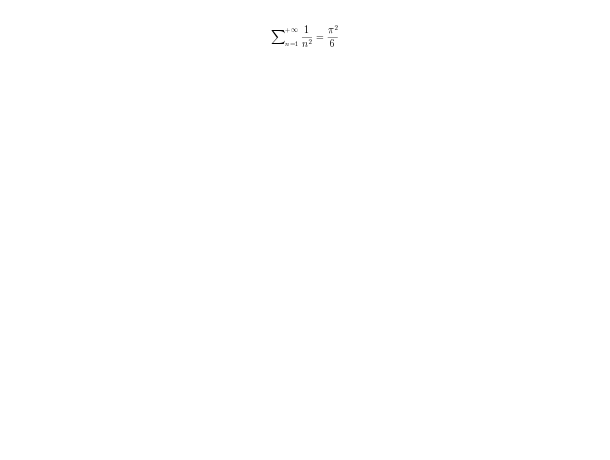
xtitle('$\textstyle\sum_{n=1}^{+\infty}\frac1{n^2}=\frac{\pi^2}{6}$')
xtitle('$\big(\bigg)$')
xtitle('$\mbox{Vector field for }\ddot{\theta}=\sin\theta$')
xtitle('$\JLaTeXMath\ \mathfrak{and}\ \mathtt{Scilab}$')
xstring(0.5,0.5,"$\overbrace{привет\ мир} \underbrace{γειά\ κόσμο}$")
JLaTeXMath fournit plusieurs polices utilisables avec les commandes \mathbb, \mathscr, \mathcal, \mathbf, \mathit, \mathsf, \mathtt, \mathfrak, \mathds, \mathrm, ainsi que leurs versions grasses quand elles existent activables avec la commande \boldsymbol :
xtitle('$\mathbb{SCILAB}\ \mathsf{or}\ \boldsymbol{\mathfrak{Scilab}}$')
xtitle('$\mathscr{C}\mbox{ n''est pas }\boldsymbol{\mathcal{C}}$')
Différents packages LaTeX sont disponibles : amsmath, amssymb, stmaryrd, amsxtra et accents ainsi que quelques commandes de graphics. La plupart des commandes de ces packages sont disponibles (il en manque quelques unes d'amsmath en l'occurence).
xtitle('$\sideset{_\alpha^\beta}{_\gamma^\delta}\prod$')
xtitle('$\hat{\accentset{\star}{\hat h}}\undertilde{ABC}$')
xtitle('$\begin{pmatrix}\mathfrak{a}&\alpha\\\mathbb{A}&\mathcal{A}\end{pmatrix}\mbox{ or }..
\begin{bmatrix}\mathfrak{a}&\alpha\\\mathbb{A}&\mathcal{A}\end{bmatrix}$')
xstring(0.5,0.5,'$\left(\frac{\pi}{\sqrt[3]{2}}\middle|\sqrt{\frac{1+\frac1x}{x}}\right\rangle$')
xtitle('$\doublecup\ddag\fatbslash\lll\oplus\ovee\circledcirc\circlearrowright$')
xtitle('$\rotatebox{180}{\boxed{\JLaTeXMath}}\ \reflectbox{\JLaTeXMath}$')
xtitle('$\scalebox{0.6}{\sum_{n=1}^{+\infty}\frac1{n^2}=\frac{\pi^2}6}$')
xtitle('$\fcolorbox{black}{Tan}{\JLaTeXMath}$')
xtitle('$\textcolor{Magenta}{\mathfrak{Scilab}}\mbox{ and }\textcolor{Green}{\mathcal{SCILAB}}$')
Il y a la possibilité de définir de nouvelles commandes ou de nouveaux environnements :
MathML description
Le rendu MathML est basé sur Jeuclid. Jeuclid est une implémentation de MathML qui couvre l'ensemble de la spécification. Ainsi, l'ensemble du langage MathML est supporté dans Scilab.
Cependant, du à la taille de la bibliothèque, à la première utilisation, le moteur peut prendre jusqu'à quelques secondes à se charger. Toutefois, les utilisations suivantes seront très rapides.
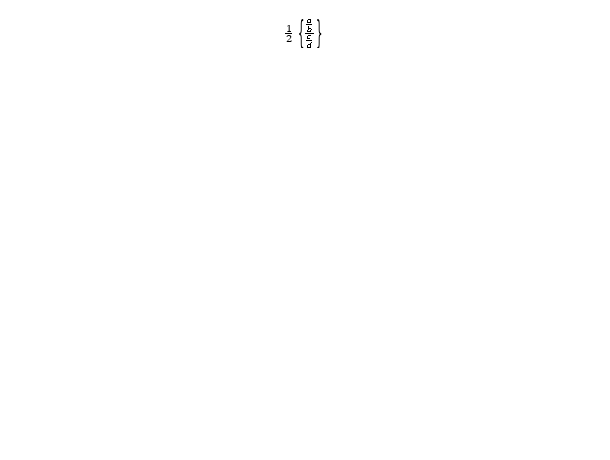
plot3d();
a=get("current_axes");
a.x_label.font_size= 5;
a.x_label.text="<mrow><mfrac><mrow><mn>1</mn></mrow><mrow><mn>2</mn></mrow></mfrac><mo></mo><mfenced open=""{"" close=""}"">" + ..
"<mrow><mfrac><mrow><mfrac><mrow><mi>a</mi></mrow><mrow><mi>b</mi></mrow></mfrac></mrow><mrow><mfrac><mrow>" + ..
"<mi>c</mi></mrow><mrow><mi>d</mi></mrow></mfrac></mrow></mfrac></mrow></mfenced></mrow>"
Voir aussi
- xtitle — add titles on a graphics window
- axes_properties — description of the axes entity properties
- label_properties — Properties of Axes labels and title
- legend_properties — description of the Legend entity properties.
- text_properties — description of the Text entity properties
- xstringb — dessine des chaînes de caractères dans une boîte
- xstringl — calcule les dimensions d'une boîte entourant des chaînes de caractères
- xstring — dessine des chaînes de caractères
| Report an issue | ||
| << graphics_fonts | text | stringbox >> |