Please note that the recommended version of Scilab is 2026.1.0. This page might be outdated.
See the recommended documentation of this function
xstringl
calcule les dimensions d'une boîte entourant des chaînes de caractères
Séquence d'appel
rect=xstringl(x,y,str,[fontId,fontSize])
Paramètres
- rect
vecteur de 4 scalaires définissant la boîte
- x,y
scalaires réels, coordonnées du point en bas à gauche des chaînes de caractères.
- str
matrice de chaînes de caractères.
A partir de la version Scilab 5.2, il est possible d'utiliser les expressions LaTeX ou MathML
- fonId
un entier specifiant le type de la fonte. Pour plus d'informations, voir graphics_fonts
- fontSize
un entier specifiant la taille de la fonte. Pour plus d'informations, voir graphics_fonts
Description
xstringl renvoie dans rect=[x,y,w,h] (point
en haut à gauche, largeur, hauteur) les dimensions d'un
rectangle dans l'échelle graphique courante entourant les chaînes de
caractères str dessinées à la position
x,y (point en bas à gauche).
Le résultat est approximatif avec le pilote PostScript.
Exemples
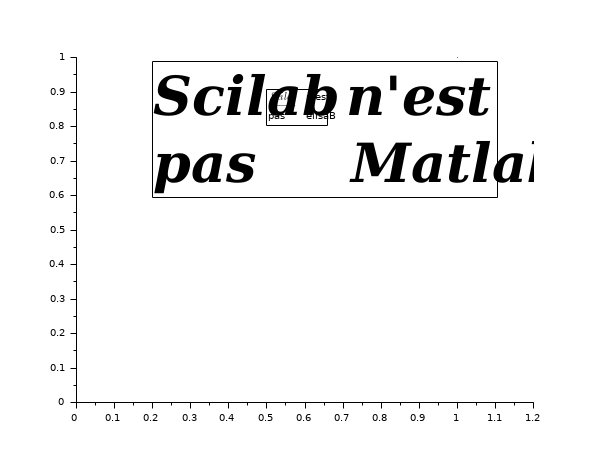
plot2d([0, 1], [0, 1], 0);
str = ["$\underleftrightarrow{Scilab}$" "n''est"; "pas" "elisaB"];
r = xstringl(0.5, 0.7, str);
xrects([r(1) r(2)+r(4) r(3) r(4)]');
xstring(r(1), r(2), str);

str = ["Scilab" "n''est "; "pas" "Matlab"];
r2 = xstringl(0.2, 0.2, str, 5, 7);
xrects([r2(1) r2(2)+r2(4) r2(3) r2(4)]');
xstring(r2(1), r2(2), str)
txt = gce();
txt.font_size = 7;
txt.font_style = 5;
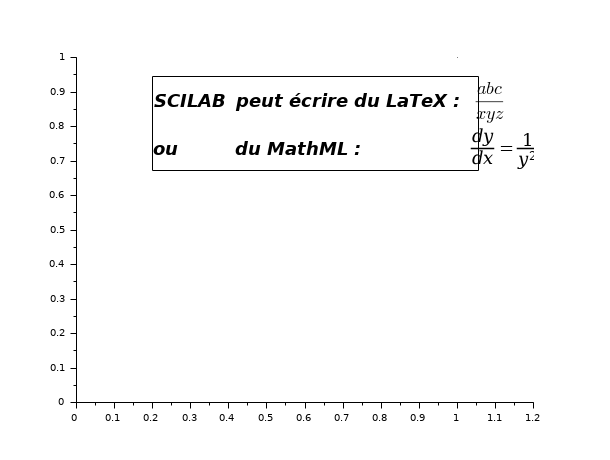
plot2d([0, 1], [0, 1], 0);
mathml = "<mrow>" +..
            "<mfrac>" +..
                "<mrow>" +..
                    "<mi> d </mi>" +..
                    "<mi> y </mi>" +..
                "</mrow>" +..
                "<mrow>" +..
                    "<mi>d</mi>" +..
                    "<mi>x</mi>" +..
                "</mrow>" +..
            "</mfrac>" +..
                "<mo> = </mo>" +..
            "<mfrac>" +..
                "<mn> 1 </mn>" +..
                "<msup>" +..
                    "<mi> y </mi>" +..
                    "<mn> 2 </mn>" +..
                "</msup>" +..
            "</mfrac>" +..
         "</mrow>";
str=["SCILAB", "peut écrire du LaTeX :", "$\frac{abc}{xyz}$"; "ou", "du MathML :", mathml];
r2 = xstringl(0.2, 0.4, str, 10, 4);
xrects([r2(1) r2(2)+r2(4) r2(3) r2(4)]');
xstring(r2(1), r2(2), str);
txt = gce();
txt.font_size = 4;
txt.font_style = 10;
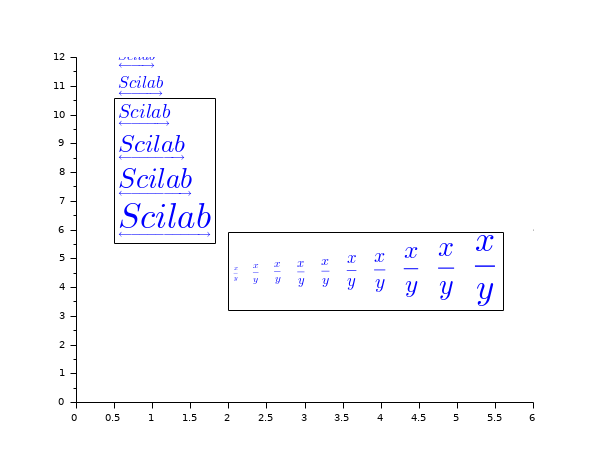
plot2d([0, 6],[0, 6], 0);
str=["$\underleftrightarrow{\tiny{Scilab}}$"; "$\underleftrightarrow{\scriptsize{Scilab}}$";
     "$\underleftrightarrow{\footnotesize{Scilab}}$"; "$\underleftrightarrow{\small{Scilab}}$";
     "$\underleftrightarrow{\normalsize{Scilab}}$"; "$\underleftrightarrow{\large{Scilab}}$";
     "$\underleftrightarrow{\Large{Scilab}}$"; "$\underleftrightarrow{\LARGE{Scilab}}$";
     "$\underleftrightarrow{\huge{Scilab}}$"; "$\underleftrightarrow{\Huge{Scilab}}$"];
r = xstringl(0.5, 0.5, str, 5, 3);
xrects([r(1); r(2)+r(4); r(3); r(4)]);
xstring(r(1), r(2), str);
txt = gce();
txt.font_size = 3;
txt.font_style = 5;
txt.font_color = 2;

str = ["${\tiny{\frac{x}{y}}$", "${\scriptsize{\frac{x}{y}}$", ..
       "${\footnotesize{\frac{x}{y}}$", "${\small{\frac{x}{y}}$", ..
       "${\normalsize{\frac{x}{y}}$", "${\large{\frac{x}{y}}$", ..
       "${\Large{\frac{x}{y}}$", "${\LARGE{\frac{x}{y}}$", ..
       "${\huge{\frac{x}{y}}$", "$\Huge{\frac{x}{y}}$"];
r = xstringl(2, 0.5, str, 0, 3);
xrects([r(1); r(2)+r(4); r(3); r(4)]);
xstring(r(1), r(2), str);
txt = gce();
txt.font_size = 3;
txt.font_style = 0;
txt.font_color = 2;
Voir aussi
| Report an issue | ||
| << xstringb | text | transform >> |